Reference Manual
Data structures: rasters (Jim) and vectors (JimVect)
Jim
- Jim(filename=None, **kwargs)
Creates a new Jim object, either from file or create new
- param filename:
Path to a raster dataset or another Jim object
- param:
see supported keys in table below
- return:
a Jim object
Jim constructor: create Jim object from file
Supported keys as arguments:
band
Bands to open, index starts from 0
ulx
Upper left x value bounding box
uly
Upper left y value bounding box
lrx
Lower right x value bounding box
lry
Lower right y value bounding box
dx
Resolution in x
dy
Resolution in y
resample
Resample algorithm used for reading pixel data
extent
filename of a vector dataset from which to get boundary constraint
nodata
Nodata value to put in image
nogeo
Use image coordinates (index starts from 0,0 for upper left pixel)
band2plane
Read multi-band raster data as multi-plane Jim object
noread
Set this flag to True to not read data when opening
Note
You can specify a different spatial reference system to define the region of interest to read set with keys ulx, uly, lrx, and lry with the extra key ‘t_srs’. Notice this will not re-project the resulting image. You can use the function
geometry.warp()or the corresponding method on a Jim objectwarp()in thegeometrymodule.Note
for resample values, please check gdal site.
Note
To reduce the memory footprint, Jim objects support a tiling mechanism (see also the tutorial on Image tiling). The following extra keys can be used to read a single tile
Specific keys for tiling:
tileindex
Read only a portion (1 / tiletotal) of the image
tiletotal
Amount of tiles in which the image must be divided (must be a squared integer)
overlap
Overlap used for tiling (expressed in percentage), default is 0 (no overlap)
align
Align the read portion of the file with the original pixel boundaries
Example:
Create Jim image object by opening an existing file (file content will automatically be read in memory):
ifn='T32TNR_20170805T102031_B08.jp2'
jim = pj.Jim(ifn)
# do stuff with jim ...
Create Jim image object by opening an existing file for specific region of interest and spatial resolution using cubic convolution resampling:
ifn = 'T32TNR_20170805T102031_B08.jp2'
jim0 = pj.Jim(ifn, noread=True)
ULX = jim0.properties.getUlx()
ULY = jim0.properties.getUly()
LRX = jim0.properties.getUlx() + 100 * jim0.properties.getDeltaX()
LRY = jim0.properties.getUly() - 100 * jim0.properties.getDeltaY()
jim = pj.Jim(ifn, ulx=ULX, uly=ULY, lrx=LRX, lry=LRY, dx=5, dy=5, resample='GRIORA_Cubic')
# do stuff with jim ...
Create Jim image object by opening an existing file, reading 10 columns and row, starting from the sixth (index=5) row and column:
ifn = 'T32TNR_20170805T102031_B08.jp2'
jim = pj.Jim(ifn, ulx=5, uly=5, lrx=14, lry=14, nogeo=True)
# do stuff with jim ...
Jim constructor: create a new Jim image object by defining image attributes (not read from file)
Supported keys as arguments:
ncol |
Number of columns |
nrow |
Number of rows |
nband |
(default: 1) Number of bands |
otype |
(default: Byte) Data type |
a_srs |
Assign the spatial reference for the output file, e.g., psg:3035 to use European projection and force to European grid |
Supported keys used to initialize random pixel values in new Jim image object:
seed |
(default: 0) seed value for random generator |
mean |
(default: 0) Mean value for random generator |
stdev |
(default: 0) Standard deviation for Gaussian random generator |
uniform |
(default: 0) Start and end values for random value with uniform distribution |
Create a new georeferenced Jim image object by defining the projection epsg code, bounding box, and pixel size:
projection = 'epsg:32612'
ULX = 600000.0
ULY = 4000020.0
LRX = 709800.0
LRY = 3890220.0
jim = pj.Jim(ulx=ULX, uly=ULY, lrx=LRX, lry=LRY, a_srs=projection, otype='GDT_UInt16', dx=100, dy=100)
# do stuff with jim ...
Create a new georeferenced Jim image object for writing by defining the projection epsg code, bounding box and number of rows and columns:
projection = 'epsg:32612'
ULX = 600000.0
ULY = 4000020.0
LRX = 709800.0
LRY = 3890220.0
jim = pj.Jim(ulx=ULX, uly=ULY, lrx=LRX, lry=LRY, a_srs=projection, otype='GDT_UInt16', ncol=1098, nrow=1098)
# do stuff with jim ...
To initialize the pixel values to some value, either use the methode Jim:setData():
jim.pixops.setData(100)
Alternatively, you can initialize the pixel values when creating the Jim object, selecting values for mean, stdev or uniform. For instance, create a new Jim object with data type float, 256 rows, 256 columns and set all values to 10:
im = pj.Jim(otype='float32', ncol=256, nrow=256, mean=10)
Random values using a Gaussian distribution function can be generated by setting a value for stdev (e.g., 2):
im = pj.Jim(otype='float32', ncol=256, nrow=256, mean=10, stdev=2)
To generate random values with a uniform distribution with values between 100 and 200:
im = pj.Jim(otype='float32', ncol=256, nrow=256, uniform=[100, 200])
Copy constructor: create a new copy of a Jim raster data object
Create a new Jim object from an existing Jim object, copying all data
jim_copy = pj.Jim(jim)Create a new Jim object, using an existing Jim object as a template, without copying data. The new jim object will be initialized with all data set to 0:
jim_copy = pj.Jim(jim, copy_data=False)
Create a new Jim raster data object from a Numpy array
Create a new Jim object by copying data from a Numpy array object (mynp):
jim = pj.np2jim(mynp)The Numpy array can be a 2D or 3D array:
jim = pj.np2jim(mynp3d)
jim.properties.nrOfPlane()
12
Notice that the newly created Jim object is not geo-referenced. We can add this information, e.g., by using a geo-reference object as a template:
jim.properties.copyGeoReference(geojim)
Jim conversions
Convert Jim object to numpy array
- Jim.np(self, band: int = 0)
Return a reference numpy array from Jim object.
- Parameters:
band – band index (starting from 0)
- Returns:
numpy array representation
Create a reference 2D numpy array from a single band GeoTIFF image (no memory copy):
jim = pj.Jim('/path/to/singleband.tif')
jim.np()
Create a reference 2D numpy array from a selected band of multiband GeoTIFF image (no memory copy):
jim = pj.Jim('/path/to/multiband.tif')
#select first band as numpy array
jim.np(0)
#select last band as numpy array
jim.np(-1)
Create a reference 3D numpy array from a multiband GeoTIFF image (no memory copy):
jim = pj.Jim('/path/to/multiband.tif',band2plane=True)
jim.np()
- jim2np(jim: Jim, band: int = 0)
Return a new numpy array from Jim object.
- Parameters:
band – band index (starting from 0)
- Returns:
numpy array object
Create a new 3D numpy array from a multiband GeoTIFF image (with memory copy):
jim = pj.Jim('/path/to/multiband.tif',band2plane=True)
array = pj.jim2np()
Convert Jim object to xarray
- Jim.xr(self)
Return a reference xarray from Jim object.
- Returns:
xarray representation
Create an xarray from a Jim data cube using the Jim member function (without memory copy):
jim = pj.Jim('/path/to/multiband.tif',band2plane=True)
jim.xr()
Multi-band 3D Jim objects can also be converted to xarray objects.
- jim2xr(jim: Jim)
Return a new xarray object from Jim object.
- Returns:
xarray representation
Create a new xarray object from a Jim data cube using the pyjeo function (with memory copy):
pj.jim2xr(jim))
To write a Jim object to NetCDF file using xarray conversion, please refer to the tutorial.
Indexing: get and set Jim items
get Jim items
- __getitem__(item)
Get subset of the raster dataset. Item can be of type:
- Tuple:
get all pixels defined by tuple (e.g., [0:10,0:10] for first 10 rows and columns in a single band image)
- Jim:
get all pixels where the specified raster dataset object is > 0
- JimVect:
get spatial subset of all pixels covered by the specified vector dataset object
- Returns:
subset of the raster dataset
Example:
Get first 10 columns in first 10 rows:
jim0[0:10, 0:10]The same result can be obtained when reading from file by constraining the bounding box in pixel (nogeo=True) coordinates:
pj.Jim('/filepath.tif',ulx = 0, uly = 0, lrx = 9, lry = 9, nogeo = True)With this method, the memory footprint is smaller, because only the required bounding box is read into memory. This is shown with in the following snippet, using the memory_profiler:
from memory_profiler import profile
import pyjeo as pj

fn = 'filepath.tif'

@profile
def f1():
    return pj.Jim(fn)[4:15,5:16]

@profile
def f2():
    return pj.Jim(fn, ulx = 4, uly = 5, lrx = 14, lry = 15, nogeo = True)

assert f1() == f2()
Result of the profiler:
Line #    Mem usage    Increment  Occurences   Line Contents
============================================================
    6     87.8 MiB     87.8 MiB           1   @profile
    7                                         def f1():
    8     96.9 MiB      9.2 MiB           1       return pj.Jim(fn)[4:15,5:16]


Filename: tests/b.py

Line #    Mem usage    Increment  Occurences   Line Contents
============================================================
    10     96.9 MiB     96.9 MiB           1   @profile
    11                                         def f2():
    12     97.4 MiB      0.5 MiB           1       return pj.Jim(fn,ulx = 4, uly = 5, lrx = 14, lry = 15, nogeo = True)
Get a binary mask of all values not within [0,250] (notice the parentheses to take care of the precedence of the operators!)
jim0[(jim0 < 0) | (jim0 > 250)]Get a binary mask identifying pixels where jim0<jim1:
jim0[(jim0 < jim1)]Crop a raster dataset according to the extent of a vector dataset (crop_to_cutline), set all pixels not covered to 0 (or value defined as no data):
ifn = 'T32TNR_20170805T102031_B08.jp2'
cfn = 'MSK_CLOUDS_B00.gml'
jim = pj.Jim(ifn)
v = pj.JimVect(cfn)
jimcloud = jim[v]
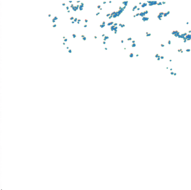
Fig. 4 Result of a Jim get item, where only pixels within the cloud mask have been retained (values are represented by a single band pseudo-color)
Set Jim items
- __setitem__(item, value)
Set items of the raster dataset. Item can be of type:
- Tuple:
set all pixels defined by tuple (e.g., [0:10,0:10] for first 10 rows and columns in a single band image)
- Jim:
set all pixels where the specified raster dataset object is > 0
- JimVect:
set all pixels covered by the specified vector dataset object
Modifies the instance on which the method was called.
Example:
Set first 10 columns in first 10 rows to 255:
jim0[0:10,0:10] = 255Set all edge pixels to 0:
jim[0, :] = 0
jim[:, 0] = 0
jim[-1, :] = 0
jim[:, -1] = 0
Mask all values not within [0, 250] and set to 255 (no data):
jim0[(jim0 < 0) | (jim0 > 250)] = 255Select the maximum of two Jim images:
jim0[(jim0 < jim1)] = jim1Set a gml cloud mask to a Jim image (setting all cloudy pixels to 255):
ifn = 'T32TNR_20170805T102031_B08.jp2'
cfn = 'MSK_CLOUDS_B00.gml'
jim = pj.Jim(ifn)
v = pj.JimVect(cfn)
jim[v] = 255
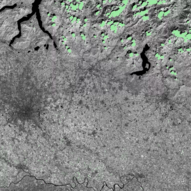
Fig. 5 Result of a Jim set item: all pixels within the vector cloud mask have been set to a value 255 (represented in green)
JimVect
Create a JimVect data object
To create a new JimVect vector data object, use the constructor JimVect(). A JimVect object is typically created by opening an existing vector dataset from file or as the result from a function or method, e.g., the method extract() in module geometry on a Jim object.
- JimVect(filename, **kwargs)
Create a new JimVect object from file
- param filename:
Path to a vector dataset
- param ln:
Layer name to read (default is to read all layers)
- param attributeFilter:
Set an attribute filter in restricted SQL WHERE format
- ulx:
Upper left x value bounding box
- uly:
Upper left y value bounding box
- lrx:
Lower right x value bounding box
- lry:
Lower right y value bounding box
- param noread:
Set this flag to True to not read data when opening
- return:
a JimVect object
Example:
Open a vector and read all layers:
v = pj.JimVect('/path/to/vector.sqlite')
Open a vector and read layer named lodi:
v = pj.JimVect('/path/to/nuts.sqlite', ln='lodi')
Open a vector and read layer named lodi and save vector to new filename:
v = pj.JimVect('/path/to/nuts.sqlite', ln='lodi')
vnew = pj.JimVect(v, output='/path/to/newvect.sqlite')
vnew.io.write()
Open a vector and use an attribute filter (the field intern_id must be between 10000 and 10500):
v = pj.JimVect('/path/to/vector.sqlite', attributeFilter='(intern_id > 10000) AND (intern_id < 10500)')
Copy constructor: create a new copy of a JimVect vector data object
Create a new JimVect object from an existing JimVect object, copying all data
v_copy = pj.JimVect(v, output = 'newcopy.sqlite')
Convert JimVect object to dictionary
- JimVect.dict(self, field: list = None, ln: int = 0)
Return numpy array from JimVect object.
- Parameters:
field – list of fields to return
ln – Layer to return
- Returns:
2D numpy array representation of all fields of all features
Example:
v = pj.Jim('/path/to/vector.sqlite')
dictobject = v.dict()
Convert JimVect object to numpy array
- JimVect.np(self, field: list = None, ln: int = 0)
Return numpy array from JimVect object.
- Parameters:
field – list of fields to return
ln – Layer to return
- Returns:
2D numpy array representation of all fields of all features
Example:
v = pj.JimVect('/path/to/features.sqlite')
v.np()
Convert JimVect object to pandas object
Example:
import pandas as pd
v = pj.Jim('/path/to/vector.sqlite')
pob = pd.DataFrame(v.dict())
Convert JimVect object to geopandas object
Example:
import geopandas as gpd
v = pj.JimVect('vector.shp)
#convert to GeoJSON in memory
vjson = pj.JimVect(v,output='/vsimem/pj.json', oformat = 'GeoJSON')
vjson.io.close()
#create geopandas dataframe from GeoJSON file in memory
gdf = gpd.read_file('/vsimem/pj.json')
Operators
Comparison operators
Jim objects support comparison operations performed at pixel level. The result is a new binary Jim object (of type Byte) with value 1 if the comparison result is True and value 0 if the comparison result is False.
Operator |
Meaning |
|---|---|
|
Pixel wise check for equality |
|
Pixel wise check for inequality |
|
Pixel wise check for less than |
|
Pixel wise check for greater than |
|
Pixel wise check for less than or equal to |
|
Pixel wise check for greater than or equal to |
Examples:
Pixel wise check for equality. The result is a binary Jim object of type Byte: 1 if pixel values are equal and 0 if objects differ:
result = jim1==jim2Set all pixel to 0 where Jim objects are equal:
jim1[jim1==jim2] = 0Pixel wise check for inequality. The result is a binary Jim object of type Byte: 0 if pixel values are equal and 1 if objects differ:
result = jim1!=jim2Set all pixel to 0 where Jim objects differ:
jim1[jim1!=jim2] = 0Pixel wise check if an image is less than another:
result = jim1<jim2Set all pixel values less than 0 to 0:
jim0[jim0<0] = 0Pixel wise check if an image is less than or equal to another:
result = jim1<=jim2Set all pixel values less than or equal to 0 to 0:
jim0[jim0<=0] = 0Pixel wise check if an image is greater than another:
result = jim1>jim2Set all pixel values greater than 0 to 0:
jim0[jim0>0] = 0Pixel wise check if an image is greater than or equal to another:
result = jim1>=jim2Set all pixel values greater than or equal to 0 to 0:
jim0[jim0>=0] = 0
Boolean operators
Jim objects support boolean operations performed at pixel level. Both input and result are assumed to be binary Jim objects of type Byte (0 is False, 1 is True).
Operator |
Meaning |
|---|---|
|
bitwise or |
|
bitwise exclusive or |
|
bitwise and |
Examples:
Calculate the bitwise or value of to Jim object:
result = jim1 | jim2Get a binary mask of all values not within [0,250] (notice the parentheses to take care of the precedence of the operators!)
result = jim0[(jim0 < 0) | (jim0 > 250)]Calculate the bitwise exclusive or (xor) value of to Jim object:
result = jim1 ^ jim2Calculate the bitwise and value of to Jim object:
result = jim1 & jim2Get a binary mask of all values within [100,200] (notice the parentheses to take care of the precedence of the operatands!)
result = jim0[(jim0 >= 100) & (jim0 <= 200)]
Arithmetic unary operators
Jim objects support unary arithmetic operations performed at pixel level.
Operator |
Meaning |
|---|---|
|
absolute value |
|
negation |
Examples:
Calculate the absolute value of Jim object:
jimabs = abs(jim)Calculate the negation of a jim object. Notice that the output data type can be changed if the input was not signed. A warning message is given:
jimneg = -jim
Arithmetic binary operators
Jim objects support binary arithmetic operations performed at pixel level.
Operator |
Meaning |
|---|---|
|
addition |
|
addition and assignment |
|
subtraction |
|
subtraction and assignment |
|
multiplication |
|
multiplication and assignment |
|
division |
|
division and assignment |
|
modulo |
|
modulo and assignment |
|
bitwise left shift |
|
bitwise left shift and assignment |
|
bitwise right shift |
|
bitwise right shift and assignment |
Examples:
Add two Jim objects and return the result as a new Jim object:
jim = jim1 + jim2Replace the content of jim1 with the sum of jim1 and jim2:
jim1 += jim2Subtract two Jim objects and return the result as a new Jim object:
jim = jim1 - jim2Replace the content of jim1 with the difference of jim1 and jim2:
jim1 -= jim2Multiply two Jim objects and return the result as a new Jim object:
jim = jim1 * jim2Replace the content of jim1 with the multiplication of jim1 and jim2:
jim1 *= jim2Divide two Jim objects and return the result as a new Jim object:
jim = jim1 / jim2Replace the content of jim1 with the division of jim1 and jim2:
jim1 /= jim2Calculate the modulo of 2 (remainder after division of 2) and return the result as a new Jim object:
jim = jim0 % 2Replace the content of jim1 with the modulo 2 (remainder after division of 2):
jim %= 2Multiply the pixel values by 2 and return as a new Jim object (by calculating the bitwise left shift):
jim2 = jim1 << 2Multiply the pixel values by 2 and replace the current Jim object (by calculating the bitwise left shift):
jim <<= 2Divide the pixel values by 2 and return as a new Jim object (by calculating the bitwise right shift):
jim2 = jim1 >> 2Divide the pixel values by 2 and replace the current Jim object (by calculating the bitwise right shift):
jim >>= 2
Accessing properties
Module for accessing Jim attributes and geospatial informations.
- properties.isEqual(first_jim, second_jim)
Check if the values of one Jim object are the same as in another one.
- Parameters:
first_jim – a Jim or JimVect object
second_jim – a Jim or JimVect object
- Returns:
True if the values are equal, zero otherwise
Jim properties
- class properties._Properties
Define all properties methods.
- clearNoData()
Clear the list of no data values for this raster dataset.
- copyGeoReference(sec_jim_object)
Copy projection and geotransform information from another image.
- Parameters:
sec_jim_object – Jim from which the projection and geotransform information should be copied.
- copyGeoTransform(sec_jim_object)
Copy geotransform information from another georeferenced image.
- Parameters:
sec_jim_object – Jim from which the geotransform information should be copied.
- covers(*args)
Check if a geolocation is covered by this dataset.
You can check the coverage for a point of interest or region of interest.
- Using a point coordinates:
x(float): x coordinate in spatial reference system of the rasterdatasety(float): y coordinate in spatial reference system of the raster dataset
- Using a region of interest:
ulx(float): upper left x coordinate in spatial reference system of the raster datasetuly(float): upper left y coordinate in spatial reference system of the raster datasetlrx(float): lower right x coordinate in spatial reference system of the raster datasetlry(float): lower right x coordinate in spatial reference system of the raster datasetall(bool): set to True if the entire bounding box must be covered by the raster dataset
Returns: True if the raster dataset covers the point or region of interest.
- getBBox(t_srs=None)
Get the bounding box (georeferenced) coordinates of this dataset.
- T_srs:
A target reference system (e.g., ‘epsg:3035, 3035, or WKT)
- Returns:
A list with upper left x, upper left y, lower right x, and lower right y
- getCenterPos()
Get the center position of this dataset in georeferenced coordinates.
- Returns:
A list with the center position of this dataset in georeferenced coordinates.
- getDataType()
Get the internal datatype for this raster dataset.
- Returns:
The datatype id of this Jim object
- getDeltaX()
Get the pixel cell spacing in x.
- Returns:
The pixel cell spacing in x.
- getDeltaY()
Get the piyel cell spacing in y.
- Returns:
The piyel cell spacing in y.
- getDimension(dimension=None)
Get the (band and plane) dimension labels for this dataset.
- Dimension:
‘band’ or ‘plane’. None will return both as a dict
- Returns:
list of dimension labels, if set
- getGeoTransform()
Get the geotransform data for this dataset as a list of floats.
- Returns:
List of floats with geotransform data:
[0] top left x
[1] w-e pixel resolution
[2] rotation, 0 if image is “north up”
[3] top left y
[4] rotation, 0 if image is “north up”
[5] n-s pixel resolution
- getLrx()
Get the lower left corner x coordinate of this dataset.
- Returns:
The lower left corner x (georeferenced) coordinate of this dataset
- getLry()
Get the lower left corner y coordinate of this dataset.
- Returns:
The lower left corner y (georeferenced) coordinate of this dataset
- getNoDataVals()
Get the list of no data values.
- getProjection()
Get the projection for this dataset in well known text (wkt) format.
- Returns:
The projection string in well known text format.
- getRefPix(*args)
Calculate the reference pixel as the center of gravity pixel.
Calculated as the weighted average of all values not taking into account no data values for a specific band (start counting from 0).
- Returns:
The reference pixel as the centre of gravity pixel (weighted average of all values not taking into account no data values) for a specific band (start counting from 0).
- getUlx()
Get the upper left corner x coordinate of this dataset.
- Returns:
The upper left corner x (georeferenced) coordinate of this dataset
- getUly()
Get the upper left corner y coordinate of this dataset.
- Returns:
The upper left corner y (georeferenced) coordinate of this dataset
- imageInfo()
Return image information (number of lines, columns, etc.).
- isEqual(other)
Check if the values of one Jim object are the same as in another.
- Parameters:
other – a Jim object
- Returns:
True if the values are equal, zero otherwise
- nrOfBand()
Get number of bands in this raster dataset.
- Returns:
The number of bands in this raster dataset
- nrOfCol()
Get number of columns in this raster dataset.
- Returns:
The number of columns in this raster dataset
- nrOfPlane()
Get number of planes in this raster dataset.
- Returns:
The number of planes in this raster dataset
- nrOfRow()
Get number of rows in this raster dataset.
- Returns:
The number of rows in this raster dataset
- printNoDataVals()
Print the list of no data values of this raster dataset.
- pushNoDataVal(value: float)
Push a no data value for this raster dataset.
- setDimension(values, dimension=None, append=False)
Set the (band and plane) dimension labels for this dataset.
- Values:
array of labels (or dict to set both ‘band’ or ‘plane’).
- Dimension:
‘band’ or ‘plane’. None will set both as a dict
- Append:
append to existing dimension labels if True
Set band labels of raster with two bands:
jim.properties.setDimension(['B0', 'B1'], 'band')
Set plane labels:
from datetime import datetime
dates = [
    datetime.strptime('2019-01-01','%Y-%m-%d'),
    datetime.strptime('2019-01-05','%Y-%m-%d')]
jim.properties.setDimension(['B0', 'B1'], 'band')
jim.properties.setDimension(dates, 'plane')
Set both band and plane labels:
from datetime import datetime
bands = ['B0', 'B1']
dates = [
    datetime.strptime('2019-01-01','%Y-%m-%d'),
    datetime.strptime('2019-01-05','%Y-%m-%d')]
jim.properties.setDimension({'plane' : dates,
                            'band' : bands})
- setGeoTransform(*args)
Set the geotransform data for this dataset.
- Args:
List of floats with geotransform data:
[0] top left x
[1] w-e pixel resolution
[2] rotation, 0 if image is “north up”
[3] top left y
[4] rotation, 0 if image is “north up”
[5] n-s pixel resolution
- setNoDataVals(value: float)
Set the list of no data value for this raster dataset.
- setProjection(*args)
Set the projection for this dataset.
Set it in well known text (wkt) format or as a string epsg:<code>.
- Args:
projection for this dataset in well known text (wkt) format or as a string epsg:<epsgcode>.
JimVect properties
- class properties._PropertiesVect
Define all properties methods for JimVects.
- getBBox(t_srs=None)
Get the bounding box (georeferenced) coordinates of this dataset.
- Returns:
A list with upper left x, upper left y, lower right x, and lower right y
- getFeatureCount(layer: int = None)
Get the number of features of this dataset.
- Layer:
the layer number (default is all layers)
- Returns:
the number of features of this layer
- getFieldNames(layer: int = 0)
Get the list of field names for this dataset.
- Parameters:
layer – The layer to get the field names, index starting from 0 (default is 0: first layer)
- Returns:
The list of field names dataset
- getLayerCount()
Get the number of layers of this dataset.
- Returns:
the number of layers of this dataset
- getLrx()
Get the lower left corner x coordinate of this dataset.
- Returns:
The lower left corner x (georeferenced) coordinate of this dataset
- getLry()
Get the lower left corner y coordinate of this dataset.
- Returns:
The lower left corner y (georeferenced) coordinate of this dataset
- getProjection(layer: int = 0)
Get the projection for this dataset in well known text (wkt) format.
- Parameters:
layer – The layer to get the projection from, index starting from 0 (default is 0: first layer)
- Returns:
The projection string in well known text format.
- getUlx()
Get the upper left corner x coordinate of this dataset.
- Returns:
The upper left corner x (georeferenced) coordinate of this dataset
- getUly()
Get the upper left corner y coordinate of this dataset.
- Returns:
The upper left corner y (georeferenced) coordinate of this dataset
- isEmpty()
Check if object contains features (non-emtpy).
- Returns:
True if empty, False if not
- isEqual(other)
Check if the values of one Jim object are the same as in another.
- Parameters:
other – a JimVect object
- Returns:
True if the values are equal, zero otherwise
JimList properties
- class properties._PropertiesList
Define all properties methods for JimLists.
- clearNoData()
Clear the list of no data values for this JimList object.
- covers(*args)
Check if a geolocation is covered by this dataset.
You can check the coverage for a point of interest or region of interest.
- Using a point coordinates:
x(float): x coordinate in spatial reference system of the raster datasety(float): y coordinate in spatial reference system of the raster dataset
- Using a region of interest:
ulx(float): upper left x coordinate in spatial reference system of the raster datasetuly(float): upper left y coordinate in spatial reference system of the raster datasetlrx(float): lower right x coordinate in spatial reference system of the raster datasetlry(float): lower right x coordinate in spatial reference system of the raster datasetall(bool): set to True if the entire bounding box must be covered by the raster dataset
Returns: True if the raster dataset covers the point or region of interest.
- getBBox(t_srs=None)
Get the bounding box (georeferenced) coordinates of this dataset.
- T_srs:
A target reference system (e.g., ‘epsg:3035, 3035, or WKT)
- Returns:
A list with upper left x, upper left y, lower right x, and lower right y
- getLrx()
Get the lower left corner x coordinate of this dataset.
- Returns:
The lower left corner x (georeferenced) coordinate of this dataset
- getLry()
Get the lower left corner y coordinate of this dataset.
- Returns:
The lower left corner y (georeferenced) coordinate of this dataset
- getNoDataVals()
Get the list of no data values.
- getUlx()
Get the upper left corner x coordinate of this dataset.
- Returns:
The upper left corner x (georeferenced) coordinate of this dataset
- getUly()
Get the upper left corner y coordinate of this dataset.
- Returns:
The upper left corner y (georeferenced) coordinate of this dataset
- pushNoDataVal(value: float)
Push a no data value for this raster JimList object.
- selectGeo(*args)
Select geographical properties (ulx, uly, …).
Input/Output methods
Module for input-output operations.
Jim Input/Output methods
- class pjio._IO
Define all IO methods.
- close()
Close Jim object.
- dumpImg(**kwargs)
Dump the raster dataset to output (standard output or ASCII file).
Supported keys as arguments:
output
Output ascii file (Default is empty: dump to standard output)
oformat
Output format: matrix or list (x,y,z) form. Default is matrix format
geo
(bool) Set to True to dump x and y in spatial reference system of raster dataset (for list form only). Default is to dump column and row index (starting from 0)
band
Band index to dump
srcnodata
Do not dump these no data values (for list form only)
force
(bool) Set to True to force full dump even for large images
- dumpImg3D(x: float, y: float, z: float, nx: int, ny: int)
Dump on screen a dx*dy window with the image values around coordinates.
Dumped within the plane z.
- Parameters:
x – x coordinate
y – y coordinate
z – z coordinate
nx – integer for size of window along x-axis
ny – integer for size of window along y-axis
- write(filename: str, **kwargs)
Write the raster dataset to file in a GDAL supported format.
- Parameters:
filename – output filename to write to
Supported keys as arguments:
oformat
(default: GTiff) Output image (GDAL supported) format
co
Creation option for output file. Multiple options can be specified as a list
nodata
Nodata value to put in image
Note
Supported GDAL output formats are restricted to those that support creation.
Example:
Create Jim image object by opening an existing file in jp2 format. Then write to a compressed and tiled file in the default GeoTIFF format:
ifn = 'T32TNR_20170805T102031_B08.jp2'
jim = pj.Jim({'filename': ifn})
jim.io.write('/tmp/test.tif', 'co': ['COMPRESS=LZW', 'TILED=YES']})
JimVect Input/Output methods
- class pjio._IOVect
Define all IO methods for JimVects.
- close()
Close JimVect object.
- dumpVect(name=None, output: str = None, **kwargs)
Dump vector content to screen or file (if output argument is provided).
- Parameters:
name – the list of field name(s) to dump (default is empty: dump all fields)
output – output ascii file (default is empty: dump to standard output)
- write(filename: str = None)
Write JimVect object to file.
If no filename is provided, the original filename with which the JimVect object was created will be used.
- Parameters:
filename – path to a raster dataset or another Jim object
JimList Input/Output methods
Pixel operations
Pixel operation functions
Module for pixel-wise operations.
- pixops.NDVI(jim_object, red, nir, name: str = None, nodata=-2, scale: float = 1.0, offset: float = 0, addBand: bool = False)
Compute NDVI on the Jim object.
- Parameters:
jim_object – Jim object from which the red and NIR bands are to be derived
red – index of band with values of red
nir – index of band with values of NIR
name – name of band for NDVI
scale – scale to multiply NDVI
offset – offset to add NDVI
addBand – add NDVI as a new band
- pixops.NDVISeparateBands(jim_red, jim_nir, name: str = None)
Compute NDVI from two Jim objects.
Values in both red and NIR equal to 0 will obtain an NDVI value of -2)
- Parameters:
jim_red – Jim object with values of red
jim_nir – Jim object with values of NIR
name – name of band for NDVI
- Returns:
a Jim object with values of NDVI
- pixops.convert(jim_object, otype)
Convert Jim image with respect to data type.
- Parameters:
jim_object – Jim object to be used for the conversion
otype – Data type for output image
- Returns:
a Jim object
Example:
Convert data type of input image to byte:
jim0 = pj.Jim('/path/to/raster.tif')
jim0.pixops.convert(otype='Byte')
Clip raster dataset between 0 and 255 (set all other values to 0), then convert data type to byte:
jim1 = pj.Jim('/path/to/raster.tif')
jim1.pixops.setThreshold(min=0, max=255, nodata=0)
jim1.pixops.convert('Byte')
- pixops.histoCompress(jim_object, band: int = None)
Redistribute the intensity of histogram to fit full range of values.
Redistributes the intensity values of im in such a way that the minimum value is zero and that all subsequent intensity values are used until the maximum value (i.e. no gaps).
- Parameters:
jim_object – Jim object to be used for the histoCompress
band – from which to get the histogram
- Returns:
a Jim object
- pixops.infimum(jim_object, *args)
Create Jim composed using minimum rule from provided Jim objects.
- Parameters:
jim – Jim object (to be sure that at least one is provided)
args – Jim objects
- Returns:
Jim composed of smalles values from provided Jim objects
- pixops.setData(jim, value: float, bbox: list = None, ulx: float = None, uly: float = None, lrx: float = None, lry: float = None, bands=None, dx: int = 0, dy: int = 0, nogeo: bool = False)
Set range of pixels to value.
- Parameters:
jim – a Jim object
value – new value for pixels of Jim object
bbox – bounding box (instead of ulx, uly, lrx, lry)
ulx – upper left corner x coordinate (in projected coordinates if geo is True, else in image coordinates)
uly – upper left corner y coordinate (in projected coordinates if geo is True, else in image coordinates)
lrx – lower right corner x coordinate (in projected coordinates if geo is True, else in image coordinates)
lry – lower right corner y coordinate (in projected coordinates if geo is True, else in image coordinates)
bands – List of band indices to crop (index is 0 based)
dx – spatial resolution in x to crop (stride if geo is False)
dy – spatial resolution in y to crop (stride if geo is False)
nogeo – use geospatial coordinates if False, image coordinates if True
- Returns:
a Jim object
- pixops.setThreshold(jim_object, **kwargs)
Apply min and max threshold to pixel values in raster dataset.
- Parameters:
jim_object – the Jim object on which to set threshold
kwargs – See table
setThreshold().
for help, please refer to the corresponding method
setThreshold().
- pixops.stretch(jim_object, **kwargs)
Stretch pixel values.
- Parameters:
jim_object – Jim object to be used for the stretch
kwargs – See table below
Modifies the instance on which the method was called.
key | value
nodata | do not consider these values
src_min
clip source below this minimum value
src_max
clip source above this maximum value
dst_min
mininum value in output image
dst_max
maximum value in output image
cc_min
cumulative count cut from
cc_max
cumulative count cut to
band
band to stretch
eq
Histogram equalization
otype
Output data type
Example:
Convert data type of input image to byte with min 0 and max 255 while stretching between cumulative counts 2 and 98 pct:
jim = pj.Jim('/path/to/raster.tif')
jim_stretched = pj.pixops.stretch(jim, otype='GDT_Byte', dst_min=0,
                                  dst_max=255, cc_min=2, cc_max=98)
- pixops.supremum(jim, *args)
Create Jim composed using maximum rule from provided Jim objects.
- Parameters:
jim – Jim object (to be sure that at least one is provided)
args – Jim objects
- Returns:
Jim composed of biggest values from provided Jim objects
Pixel operation methods on Jim
- class pixops._PixOps
Define all PixOps methods.
- NDVI(red, nir, name: str = None, nodata=-2, scale: float = 1.0, offset: float = 0, addBand: bool = False)
Compute NDVI on the Jim object.
Modifies the instance on which the method was called.
- Parameters:
red – index of band with values of red
nir – index of band with values of NIR
name – name of band for NDVI
scale – scale to multiply NDVI
offset – offset to add NDVI
addBand – add NDVI as a new band
- NDVISeparateBands(jim_nir, name: str = None)
Compute NDVI from two Jims (call on red band, use NIR as param).
Values in both red and NIR equal to 0 will obtain an NDVI value of -2)
Modifies the instance on which the method was called.
- Parameters:
jim_nir – Jim object with values of NIR
name – name of band for NDVI
- convert(otype)
Convert Jim image with respect to data type.
- Parameters:
otype – Data type for output image
Modifies the instance on which the method was called.
Example:
Convert data type of input image to byte:
jim0 = pj.Jim('/path/to/raster.tif')
jim0.pixops.convert(otype='Byte')
Clip raster dataset between 0 and 255 (set all other values to 0), then convert data type to byte:
jim1 = pj.Jim('/path/to/raster.tif')
jim1.setThreshold(min=0, max=255, nodata=0)
jim1.pixops.convert('Byte')
- histoCompress(band: int = None)
Redistribute the intensity of histogram to fit full range of values.
Redistributes the intensity values of im in such a way that the minimum value is zero and that all subsequent intensity values are used until the maximum value (i.e. no gaps).
Modifies the instance on which the method was called.
- Parameters:
band – from which to get the histogram
- infimum(*args)
Change values of Jim using mimimum composition rule.
Modifies the instance on which the method was called.
- Parameters:
args – Jim objects
- setData(value: float, bbox: list = None, ulx: float = None, uly: float = None, lrx: float = None, lry: float = None, bands=None, dx: int = 0, dy: int = 0, nogeo: bool = False)
Set range of pixels to value.
- Parameters:
value – new value for pixels of Jim object
bbox – bounding box (instead of ulx, uly, lrx, lry)
ulx – upper left corner x coordinate (in projected coordinates if geo is True, else in image coordinates)
uly – upper left corner y coordinate (in projected coordinates if geo is True, else in image coordinates)
lrx – lower right corner x coordinate (in projected coordinates if geo is True, else in image coordinates)
lry – lower right corner y coordinate (in projected coordinates if geo is True, else in image coordinates)
bands – List of band indices to crop (index is 0 based)
dx – spatial resolution in x to crop (stride if geo is False)
dy – spatial resolution in y to crop (stride if geo is False)
nogeo – use geospatial coordinates if False, image coordinates if True
- Returns:
a Jim object
- setThreshold(**kwargs)
Apply min and max threshold to pixel values in raster dataset.
- Parameters:
kwargs – See table below
Modifies the instance on which the method was called.
key
value
min
Minimum threshold value (if pixel value < min set pixel value to no data)
max
Maximum threshold value (if pixel value > max set pixel value to no data)
value
value to be set if within min and max (if not set, valid pixels will remain their input value)
abs
Set to True to perform threshold test to absolute pixel values
nodata
Set pixel value to this no data if pixel value < min or > max
Note
A simplified interface to set a threshold is provided via indexing (see also example below).
Example:
Mask all values not within [0, 250] and set to 255:
jim0[(jim0<0) | (jim0>250)] = 255
Mask all values not within [0, 250] and set to 255 (no data):
jim_threshold = jim.setThreshold(min=0, max=250, nodata=255)
- stretch(**kwargs)
Stretch pixel values.
Modifies the instance on which the method was called.
- Parameters:
kwargs – See table below
Modifies the instance on which the method was called.
key | value
nodata | do not consider these values
src_min
clip source below this minimum value
src_max
clip source above this maximum value
dst_min
mininum value in output image
dst_max
maximum value in output image
cc_min
cumulative count cut from
cc_max
cumulative count cut to
band
band to stretch
eq
Histogram equalization
otype
Output data type
Example:
Convert data type of input image to byte with min 0 and max 255 while stretching between cumulative counts 2 and 98 pct:
jim = pj.Jim('/path/to/raster.tif')
jim_stretched = pj.pixops.stretch(jim, otype='GDT_Byte', dst_min=0,
                                  dst_max=255, cc_min=2, cc_max=98)
- supremum(*args)
Change values of Jim using maximum composition rule.
Modifies the instance on which the method was called.
- Parameters:
args – Jim objects
Pixel operation methods on JimList
- class pixops._PixOpsList
Define all PixOps methods for JimLists.
- infimum()
Create Jim composed using minimum rule from Jim objects in JimList.
- Returns:
Jim composed of smallest values from provided Jim objects
- supremum()
Create Jim composed using maximum rule from Jim objects in JimList.
- Returns:
Jim composed of biggest values from provided Jim objects
Neighborhood operations
Neighborhood operation from scipy (ndimage)
The neighborhood operations from scipy ndimage can be applied to a Jim object by using its numpy representation (Jim.np())
Perform a Gaussian filter on a single band Jim object using a standard deviation (sigma) of 2:
from scipy import ndimage
jim = pj.Jim('/path/to/image.tif')
jim.np()[:] = ndimage.gaussian_filter(jim.np(), 2)
More examples are provided in the Tutorial on image filtering.
Native neighborhood operation functions
Module for neighbourhood operations.
- ngbops.dwt1d(jim_object, wavelet: str = None, family: str = None, **kwargs)
Compute discrete forward wavelet transform in time-spectral domain.
- Parameters:
jim_object – a Jim object of data type GDT_Float64
wavelet – wavelet type: daubechies,daubechies_centered, haar, haar_centered, bspline, bspline_centered
family – wavelet family, see also https://www.gnu.org/software/gsl/doc/html/dwt.html
- Returns:
filtered Jim object
Example:
jim = pj.Jim('/path/to/multi-band/image.tif', band2plane=True)
jim.pixops.convert('GDT_Float64')

dwt = pj.ngbops.dwt1d(jim)
dwt.ngbops.dwti1d()
- ngbops.dwt2d(jim_object, wavelet: str = None, family: str = None, **kwargs)
Compute forward discrete wavelet transform in the spatial domain.
- Parameters:
jim_object – a Jim object of data type GDT_Float64
wavelet – wavelet type: daubechies,daubechies_centered, haar, haar_centered, bspline, bspline_centered
family – wavelet family, see also https://www.gnu.org/software/gsl/doc/html/dwt.html
- Returns:
filtered Jim object
Example:
jim = pj.Jim('/path/to/multi-band/image.tif', band2plane=True)
jim.pixops.convert('GDT_Float64')

dwt = pj.ngbops.dwt2d(jim)
dwt.ngbops.dwti2d()
- ngbops.dwti1d(jim_object, wavelet: str = None, family: str = None, **kwargs)
Compute inverse discrete wavelet transform in time-spectral domain.
- Parameters:
jim_object – a Jim object of data type GDT_Float64
wavelet – wavelet type: daubechies,daubechies_centered, haar, haar_centered, bspline, bspline_centered
family – wavelet family, see also https://www.gnu.org/software/gsl/doc/html/dwt.html
- Returns:
filtered Jim object
Example:
jim = pj.Jim('/path/to/multi-band/image.tif', band2plane=True)
jim.pixops.convert('GDT_Float64')

dwt = pj.ngbops.dwt1d(jim)
dwt.ngbops.dwti1d()
Approximate a 3D image by setting all wavelet coefficients below some percentile value (e.g., 10) to 0:
jim = pj.Jim('/path/to/multi-band/image.tif', band2plane=True)
jim.pixops.convert('GDT_Float64')

jim.ngbops.dwt1d()
jimabs = pj.Jim(jim)
jimabs = abs(jimabs)
thresholds = np.percentile(jimabs.np(), 90, axis=0)
jim[jimabs < thresholds] = 0
jim.ngbops.dwti1d()
- ngbops.dwti2d(jim_object, wavelet: str = None, family: str = None, **kwargs)
Compute inverse discrete wavelet transform in the spatial domain.
- Parameters:
jim_object – a Jim object of data type GDT_Float64
wavelet – wavelet type: daubechies,daubechies_centered, haar, haar_centered, bspline, bspline_centered
family – wavelet family, see also https://www.gnu.org/software/gsl/doc/html/dwt.html
- Returns:
filtered Jim object
Example:
jim = pj.Jim('/path/to/multi-band/image.tif', band2plane=True)
jim.pixops.convert('GDT_Float64')

dwt = pj.ngbops.dwt2d(jim)
dwt.ngbops.dwti2d()
- ngbops.edgeWeight(jim_object, dir: int = 0, type: int = 0)
Compute the weights of the horizontal or vertical edges.
Linking any pair of horizontally or vertically adjacent pixels.
- Parameters:
jim_object – Jim object on which to perform the computation
dir – integer for coding edge direction (horizontal if 0, vertical otherwise).
type – integer determining how the edge weights are computed: 0 for absolute difference (default), 1 for maximum value, 2 for minimum value.
- ngbops.filter1d(jim_object, filter: str, dz: int = None, pad: str = 'symmetric', otype=None, **kwargs)
Subset raster dataset in spectral/temporal domain.
This function is deprecated
Filter Jim object in spectral/temporal domain performed on multi-band raster dataset.
- Parameters:
jim_object – a Jim object
filter – filter function (see values for different filter types supported filters)
dz – filter kernel size in z (spectral/temporal dimension), must be odd (example: 3)
pad – Padding method for filtering (how to handle edge effects). Possible values are: symmetric (default), replicate, circular, zero (pad with 0)
otype – Data type for output image
- Returns:
filtered Jim object
see the corresponding method
filter1d()for more information
- ngbops.filter2d(jim_object, filter: str, dx: int = 3, dy: int = 3, pad: str = 'symmetric', otype=None, **kwargs)
Subset raster dataset in spectral/temporal domain.
#This function is deprecated
Filter Jim object in spatial domain performed on single or multi-band raster dataset.
- Parameters:
jim_object – a Jim object
filter – filter function (see values for different filter types supported filters)
dx – filter kernel size in x, use odd values only (default is 3)
dy – filter kernel size in y, use odd values only (default is 3)
pad – Padding method for filtering (how to handle edge effects). Possible values are: symmetric (default), replicate, circular, zero (pad with 0)
otype – Data type for output image
- Returns:
filtered Jim object
see the corresponding method
filter2d()for more information
- ngbops.firfilter1d(jim_object, taps, pad: str = 'symmetric', **kwargs)
Compute the finite impulse response filter in time-spectral domain.
- Parameters:
jim_object – a Jim object (the same data type will be used for output)
taps – 1D array of filter taps
pad – Padding method for filtering (how to handle edge effects). Choose between: symmetric, replicate, circular, zero (pad with 0)
- Returns:
filtered Jim object
Example:
jim = pj.Jim('/path/to/image.tif')

filtered = pj.ngbops.firfilter1d(jim, taps=np.array([1, 2, 1]),
                                 norm=True, pad='symmetric')
- ngbops.firfilter2d(jim_object, taps, nodata=None, norm=None, **kwargs)
Compute the finite impulse response filter in spatial domain.
- Parameters:
jim_object – a Jim object (the same data type will be used for output)
taps – 2D array of filter taps
nodata – list of no data values not to take into account when calculating the filter response
norm – normalize tap values
- Returns:
filtered Jim object
Example:
jim = pj.Jim('/path/to/image.tif')

filtered = pj.ngbops.firfilter2d(jim, taps=np.array([[1, 2, 1]]),
                                 norm=True, pad='symmetric')
- ngbops.getDissim(jimo, dissim_type: int = 0)
Compute the dissimilarities between horizontal and vertical pairs of adjacent pixels.
- Parameters:
jimo – a list of grey level Jim objects with the same definition domain. The dissimilarities are calculated for each image separately and composed using the point-wise maximum rule.
dissim_type – integer value indicating the type of dissimilarity measure. 0 (default) for absolute difference. 1 for dissimilarity measure countering the chaining effect as described in [Soi11]
- Returns:
a list of 2 Jim objects holding the horizontal and vertical dissimilarities respectively
- ngbops.labelPixNgb(jim_object, sec_jim_object, ox: float, oy: float, oz: float)
Label pix ngb.
- Parameters:
jim_object – Jim object on which to perform the labelling
sec_jim_object – a Jim object
ox – x coordinate
oy – y coordinate
oz – z coordinate
- Returns:
labelled Jim object
- ngbops.morphoDilate(jim_object, sec_jim_object, ox: float, oy: float, oz: float, tr_flag: bool = 0)
Output the dilation of im using the SE defined by imse.
Its origin is set at coordinates (x,y,z). The reflection of the SE is considered if trflag equals 1 (no reflection by default). Points of the SE are points with a non zero value in imse.
- Parameters:
jim_object – image on which to perform the dilation
sec_jim_object – an image node for SE (UCHAR type)
ox – x coordinate
oy – y coordinate
oz – z coordinate
tr_flag – optional parameter (0 or 1)
- ngbops.morphoDilateDiamond(jim_object)
Output the dilation of im using the elementary diamond shaped SE.
- Parameters:
jim_object – a Jim object
- ngbops.morphoDilateLine(jim_object, dx: int, dy: int, k: int, o: int, type: int = 0)
Output the dilation of im.
Uses the line SE with slope dy/dx, length k, origin o, and line type (see details at [SBJ96]).
- Parameters:
jim_object – image on which to perform the dilation
dx – integer for displacement along x-axis to set slope
dy – integer for displacement along y-axis to set slope
k – integer for number of pixels of line SE (must be odd; if not, it is extended by one pixel)
o – integer for origin of SE
type – integer for line type (0 for plain and 1 for periodic). 0 is the default value
- ngbops.morphoErode(jim_object, sec_jim_object, ox: float, oy: float, oz: float, tr_flag: bool = 0)
Output the erosion of im using the SE defined by imse.
Its origin is set at coordinates (x,y,z). The reflection of the SE is considered if trflag equals 1 (no reflection by default). Points of the SE are points with a non zero value in imse.
- Parameters:
jim_object – image on which to perform the erosion
sec_jim_object – an image node for SE (UCHAR type)
ox – x coordinate
oy – y coordinate
oz – z coordinate
tr_flag – optional parameter (0 or 1)
- ngbops.morphoErodeDiamond(jim_object)
Output the erosion of im using the elementary diamond shaped SE.
- Parameters:
jim_object – a Jim object
- ngbops.morphoErodeLine(jim_object, dx: int, dy: int, k: int, o: int, type: int = 0)
Output the erosion of im using a line segment.
Uses the line SE with slope dy/dx, length k, origin o, and line type. See details at [SBJ96].
- Parameters:
jim_object – image on which to perform the erosion
dx – integer for displacement along x-axis to set slope
dy – integer for displacement along y-axis to set slope
k – integer for number of pixels of line SE (must be odd; if not, it is extended by one pixel)
o – integer for origin of SE
type – integer for line type (0 for plain and 1 for periodic). 0 is the default value
- ngbops.morphoGradientByDilationDiamond(jim_object)
Output the gradient by dilation of Jim.
Uses the elementary diamond shaped SE.
- ngbops.morphoGradientByErosionDiamond(jim_object)
Output the gradient by erosion of Jim.
Uses the elementary diamond shaped SE.
- ngbops.savgolay(jim_object, nl: int = None, nr: int = None, ld: int = None, m: int = None, **kwargs)
Compute the Savitzky-Golay filter in the time-spectral domain.
- Parameters:
jim_object – a Jim object of data type GDT_Float64
nl – Number of leftward (past) data points used in Savitzky- Golay filter)
nr – Number of rightward (future) data points used in Savitzky- Golay filter)
ld – order of the derivative desired in Savitzky-Golay filter (e.g., ld=0 for smoothed function)
m – order of the smoothing polynomial in Savitzky-Golay filter, also equal to the highest conserved moment; usual values are m=2 or m=4)
- Returns:
filtered Jim object
Example:
Perform a Savitzky-Golay filter to reconstruct a time series data set as in J. Chen 2004:
jim = pj.Jim('/path/to/multi-band/image.tif', band2plane=True)
jim.pixops.convert('GDT_Float64')

savgol = pj.ngbops.savgolay(jim, nl=7, nr=7, m=2, pad='replicate')
for loop in range(0, 10):
    savgol.pixops.convert(otype=jim.properties.getDataType())
    savgol[savgol < jim] = jim
    savgol = pj.ngbops.savgolay(savgol, nl=4, nr=4, m=6,
                                pad='replicate')
- ngbops.smoothNoData1d(jim_object, nodata: float = 0, interpolation_type: str = None, **kwargs)
Smooth nodata in spectral/temporal domain.
- Parameters:
jim_object – input Jim object
nodata – no data value to interpolate
interpolation_type – type of interpolation for spectral filtering (see https://www.gnu.org/software/gsl/doc/html/interp.html)
Example:
jim = pj.Jim('/path/to/multi-band/image.tif', band2plane=True)
jim.pixops.convert('GDT_Float64')

pj.ngbops.smoothNoData1d(jim, 0)
Native neighborhood operation methods on Jim
- class ngbops._NgbOps
Define all NgbOps methods.
- dwt1d(wavelet: str = None, family: str = None, **kwargs)
Compute discrete forward wavelet transform in time-spectral domain.
- Parameters:
wavelet – wavelet type: daubechies,daubechies_centered, haar, haar_centered, bspline, bspline_centered
family – wavelet family, see also https://www.gnu.org/software/gsl/doc/html/dwt.html
Example:
jim = pj.Jim('/path/to/multi-band/image.tif', band2plane=True)
jim.pixops.convert('GDT_Float64')

jim.ngbops.dwt1d()
jim.ngbops.dwti1d()
- dwt2d(wavelet: str = None, family: str = None, **kwargs)
Compute forward discrete wavelet transform in the spatial domain.
- Parameters:
wavelet – wavelet type: daubechies,daubechies_centered, haar, haar_centered, bspline, bspline_centered
family – wavelet family, see also https://www.gnu.org/software/gsl/doc/html/dwt.html
Example:
jim = pj.Jim('/path/to/image.tif')
jim.pixops.convert('GDT_Float64')

jim.ngbops.dwt2d()
jim.ngbops.dwti2d()
- dwti1d(wavelet: str = None, family: str = None, **kwargs)
Compute inverse discrete wavelet transform in time-spectral domain.
- Parameters:
wavelet – wavelet type: daubechies,daubechies_centered, haar, haar_centered, bspline, bspline_centered
family – wavelet family, see also https://www.gnu.org/software/gsl/doc/html/dwt.html
Example:
jim = pj.Jim('/path/to/multi-band/image.tif', band2plane=True)
jim.pixops.convert('GDT_Float64')

jim.ngbops.dwt1d()
jim.ngbops.dwti1d()
Approximate a 3D image by setting all wavelet coefficients below some percentile value (e.g., 10) to 0:
jim = pj.Jim('/path/to/multi-band/image.tif', band2plane=True)
jim.pixops.convert('GDT_Float64')

jim.ngbops.dwt1d()
jimabs = pj.Jim(jim)
jimabs = abs(jimabs)
thresholds = np.percentile(jimabs.np(), 90, axis=0)
jim[jimabs < thresholds] = 0
jim.ngbops.dwti1d()
- dwti2d(wavelet: str = None, family: str = None, **kwargs)
Compute inverse discrete wavelet transform in the spatial domain.
- Parameters:
wavelet – wavelet type: daubechies,daubechies_centered, haar, haar_centered, bspline, bspline_centered
family – wavelet family, see also https://www.gnu.org/software/gsl/doc/html/dwt.html
Example:
jim = pj.Jim('/path/to/image.tif')
jim.pixops.convert('GDT_Float64')

jim.ngbops.dwt2d()
jim.ngbops.dwti2d()
- edgeWeight(dir: int = 0, type: int = 0)
Compute the weights of the horizontal or vertical edges.
Linking any pair of horizontally or vertically adjacent pixels.
Modifies the instance on which the method was called.
- Parameters:
dir – integer for coding edge direction (horizontal if 0, vertical otherwise).
type – integer determining how the edge weights are computed: 0 for absolute difference (default), 1 for maximum value, 2 for minimum value.
- filter1d(filter: str, dz: int = None, pad: str = 'symmetric', otype=None, **kwargs)
Subset raster dataset in spectral/temporal domain.
This function is deprecated
Filter Jim image in spectral/temporal domain performed on multi-band raster dataset.
- Parameters:
filter – filter function (see values for different filter types supported filters)
dz – filter kernel size in z (spectral/temporal dimension), must be odd (example: 3)
pad – Padding method for filtering (how to handle edge effects). Possible values are: symmetric (default), replicate, circular, zero (pad with 0)
otype – Data type for output image
- Morphological filters:
filter
description
dilate
morphological dilation
erode
morphological erosion
close
morpholigical closing (dilate+erode)
open
morpholigical opening (erode+dilate)
Note
The morphological filter uses a linear structural element with a size defined by the key ‘dz’
Example:
Perform a morphological dilation with a linear structural element of size 5:
jim_filtered = jim.ngbops.filter1d('dilate', dz=5)
- Statistical filters:
filter
description
smoothnodata
smooth nodata values (set nodata option!)
nvalid
report number of valid (not nodata) values in window
median
perform a median filter
var
calculate variance in window
min
calculate minimum in window
max
calculate maximum in window
sum
calculate sum in window
mean
calculate mean in window
stdev
calculate standard deviation in window
percentile
calculate percentile value in window
proportion
calculate proportion in window
Note
You can specify the no data value for the smoothnodata filter with the extra key ‘nodata’ and a list of no data values. The interpolation type can be set with the key ‘interp’ (check complete list of values, removing the leading “gsl_interp”).
Example:
Smooth the 0 valued pixel values using a linear interpolation in a spectral/temporal neighborhood of 5 bands:
jim.ngbops.filter1d('smoothnodata', dz=5, nodata=0,
                    interp='linear')
- Wavelet filters:
Perform a wavelet transform (or inverse) in spectral/temporal domain.
Note
The wavelet coefficients can be positive and negative. If the input raster dataset has an unsigned data type, make sure to set the output to a signed data type using the key ‘otype’.
You can use set the wavelet family with the key ‘family’ in the dictionary. The following wavelets are supported as values:
daubechies
daubechies_centered
haar
haar_centered
bspline
bspline_centered
filter
description
dwt
discrete wavelet transform
dwti
discrete inverse wavelet transform
dwt_cut
DWT approximation in spectral domain
Note
The filter ‘dwt_cut’ performs a forward and inverse transform, approximating the input signal. The approximation is performed by discarding a percentile of the wavelet coefficients that can be set with the key ‘threshold’. A threshold of 0 (default) retains all and a threshold of 50 discards the lower half of the wavelet coefficients.
Example:
Approximate the multi-temporal raster dataset by discarding the lower 20 percent of the coefficients after a discrete wavelet transform. The input dataset has a Byte data type. We wavelet transform is calculated using an Int16 data type. The approximated image is then converted to a Byte dataset, making sure all values below 0 and above 255 are set to 0:
jim_multitemp.ngbops.filter1d('dwt_cut', threshold=20, otype=Int16)
jim_multitemp[(jim_multitemp<0) | (jim_multitemp>255)]=0
jim_multitemp.convert(otype='Byte')
- Hyperspectral filters:
Hyperspectral filters assume the bands in the input raster dataset correspond to contiguous spectral bands. Full width half max (FWHM) and spectral response filters are supported. They converts an N band input raster dataset to an M (< N) band output raster dataset.
The full width half max (FWHM) filter expects a list of M center wavelenghts and a corresponding list of M FWHM values. The M center wavelenghts define the output wavelenghts and must be provided with the key ‘wavelengthOut’. For the FHWM, use the key ‘fwhm’ and a list of M values. The algorithm needs to know the N wavelenghts that correspond to the N bands of the input raster dataset. Use the key ‘wavelengthIn’ and a list of N values. The units of input, output and FWHM are arbitrary, but should be identical (e.g., nm).
Example:
Covert the hyperspectral input raster dataset, with the wavelengths defined in the list wavelenghts_in to a multispectral raster dataset with three bands, corresponding to Red, Green, and Blue:
wavelengths_in = []
# define the wavelenghts of the input raster dataset

if len(wavelengths_in) == jim_hyperspectral.nrOfBand():
    jim_hyperspectral.ngbops.filter1d(
        wavelengthIn=wavelenghts_in,
        wavelengthOut=[650, 510, 475],
        fwhm=[50, 50, 50])
else:
    print("Error: number of input wavelengths must be equal to "
          "number of bands in input raster dataset")
Note
The input wavelenghts are automatically interpolated. You can specify the interpolation using the key ‘interp’ and values as listed interpolation https://www.gnu.org/software/gsl/doc/html/interp.html
The spectral response filter (SRF)
The input raster dataset is filtered with M of spectral response functions (SRF). Each spectral response function must be provided by the user in an ASCII file that consists of two columns: wavelengths and response. Use the key ‘srf’ and a list of paths to the ASCII file(s). The algorithm automatically takes care of the normalization of the SRF.
Example:
Covert the hyperspectral input raster dataset, to a multispectral raster dataset with three bands, corresponding to Red, Green, and Blue as defined in the ASCII text files ‘srf_red.txt’, ‘srf_green.txt’, ‘srf_blue.txt’:
wavelengths_in = []
# specify the wavelenghts of the input raster dataset

if len(wavelengths_in) == jim_hyperspectral.nrOfBand():
    rgb = jim_hyperspectral.ngbops.filter1d(
        wavelengthIn=wavelenghts_in,
        srf=['srf_red.txt', 'srf_green.txt', 'srf_blue.txt'])
else:
    print("Error: number of input wavelengths must be equal to "
          "number of bands in input raster dataset")
Note
The input wavelenghts are automatically interpolated. You can specify the interpolation using the key ‘interp’ and values as listed interpolation https://www.gnu.org/software/gsl/doc/html/interp.html
- Custom filters:
For the custom filter, you can specify your own taps using the keyword ‘tapz’ and a list of filter tap values. The tap values are automatically normalized by the algorithm.
Example:
Perform a simple smoothing filter by defining three identical tap values:
jim.ngbops.filter1d(tapz=[1, 1, 1])
- filter2d(filter: str, dx: int = 3, dy: int = 3, pad: str = 'symmetric', otype=None, **kwargs)
Subset raster dataset in spectral/temporal domain.
This function is deprecated
Filter Jim object in spatial domain performed on single or multi-band raster dataset.
- Parameters:
filter – filter function (see values for different filter types supported filters)
dx – filter kernel size in x, use odd values only (default is 3)
dy – filter kernel size in y, use odd values only (default is 3)
pad – Padding method for filtering (how to handle edge effects). Possible values are: symmetric (default), replicate, circular, zero (pad with 0)
otype – Data type for output image
Edge detection
filter
description
sobelx
Sobel operator in x direction
sobely
Sobel operator in y direction
sobelxy
Sobel operator in x and y direction
homog
binary value indicating if pixel is identical to all pixels in kernel
heterog
binary value indicating if pixel is different than all pixels in kernel
Example:
Perform Sobel edge detection in both x and direction:
jim_filtered = jim.ngbops.filter2d('sobelxy')
Morphological filters
filter
description
dilate
morphological dilation
erode
morphological erosion
close
morpholigical closing (dilate+erode)
open
morpholigical opening (erode+dilate)
Note
You can use the optional key ‘class’ with a list value to take only these pixel values into account. For instance, use ‘class’:[255] to dilate clouds in the raster dataset that have been flagged with value 255. In addition, you can use a circular disc kernel (set the key ‘circular’ to True).
Example:
Perform a morphological dilation using a circular kernel with size (diameter) of 5 pixels:
jim.ngbops.filter2d('dilate', dx=5, dy=5, circular=True)
Note
For a more comprehensive list of morphological operators, please refer to the corresponding methods, e.g.,
morphoDilate()Statistical filters
filter
description
smoothnodata
smooth nodata values (set nodata option!)
nvalid
report number of valid (not nodata) values in window
median
perform a median filter
var
calculate variance in window
min
calculate minimum in window
max
calculate maximum in window
ismin
binary value indicating if pixel is minimum in kernel
ismax
binary value indicating if pixel is maximum in kernel
sum
calculate sum in window
mode
calculate the mode (only for categorical values)
mean
calculate mean in window
stdev
calculate standard deviation in window
percentile
calculate percentile value in window
proportion
calculate proportion in window
Note
You can specify the no data value for the smoothnodata filter with the extra key ‘nodata’ and a list of no data values. The interpolation type can be set with the key ‘interp’ (check complete list of values, removing the leading “gsl_interp”).
Example:
Perform a median filter with kernel size of 3x3 pixels:
jim.ngbops.filter2d('median', dx=5, dy=5)
Wavelet filters
Perform a wavelet transform (or inverse) in spatial domain.
Note
The wavelet coefficients can be positive and negative. If the input raster dataset has an unsigned data type, make sure to set the output to a signed data type using the key ‘otype’.
You can use set the wavelet family with the key ‘family’ in the dictionary. The following wavelets are supported as values:
daubechies
daubechies_centered
haar
haar_centered
bspline
bspline_centered
filter
description
dwt
discrete wavelet transform
dwti
discrete inverse wavelet transform
dwt_cut
DWT approximation in spectral domain
Note
The filter ‘dwt_cut’ performs a forward and inverse transform, approximating the input signal. The approximation is performed by discarding a percentile of the wavelet coefficients that can be set with the key ‘threshold’. A threshold of 0 (default) retains all and a threshold of 50 discards the lower half of the wavelet coefficients.
Example:
Approximate the multi-temporal raster dataset by discarding the lower 20 percent of the coefficients after a discrete wavelet transform. The input dataset has a Byte data type. We wavelet transform is calculated using an Int16 data type. The approximated image is then converted to a Byte dataset, making sure all values below 0 and above 255 are set to 0:
jim_multitemp.ngbops.filter2d('dwt_cut', threshold=20, otype=Int16)
jim_multitemp[(jim_multitemp < 0) | (jim_multitemp > 255)] = 0
jim_multitemp.convert(otype='Byte')
- firfilter1d(taps, pad: str = 'symmetric', **kwargs)
Compute the finite impulse response filter in time-spectral domain.
- Parameters:
taps – 1D array of filter taps
pad – Padding method for filtering (how to handle edge effects). Choose between: symmetric, replicate, circular, zero (pad with 0)
- Returns:
filtered Jim object
Example:
jim = pj.Jim('/path/to/image.tif')

jim.firfilter1d(jim, taps=np.array([1, 2, 1]), pad='symmetric')
- firfilter2d(taps, nodata=None, norm=None, **kwargs)
Compute the finite impulse response filter in spatial domain.
- Parameters:
taps – 2D array of filter taps
nodata – list of no data values not to take into account when calculating the filter response
norm – normalize tap values
- Returns:
filtered Jim object
Example:
jim = pj.Jim('/path/to/image.tif')

jim.ngbops.firfilter2d(taps=np.array([[1, 1, 1],[1, 2, 1],[1, 1, 1]]),
                       norm=True, pad='symmetric')
- getDissim(jimo=None, dissim_type: int = 0)
Compute the dissimilarities.
Compute the dissimilarities between horizontal and vertical pairs of adjacent pixels.
- Parameters:
jimo – a list of grey level Jim objects with the same definition domain. The dissimilarities are calculated for each image separately and composed using the point-wise maximum rule.
dissim_type – integer value indicating the type of dissimilarity measure. 0 (default) for absolute difference. 1 for dissimilarity measure countering the chaining effect as described in [Soi11].
- labelPixNgb(sec_jim_object, ox: float, oy: float, oz: float)
Label pix ngb.
Modifies the instance on which the method was called.
- Parameters:
sec_jim_object – a Jim object
ox – x coordinate
oy – y coordinate
oz – z coordinate
- Returns:
labelled Jim object
- morphoDilate(sec_jim_object, ox: float, oy: float, oz: float, tr_flag: bool = 0)
Output the dilation of im using the SE defined by imse.
Its origin is set at coordinates (x,y,z). The reflection of the SE is considered if trflag equals 1 (no reflection by default). Points of the SE are points with a non zero value in imse.
Modifies the instance on which the method was called.
- Parameters:
sec_jim_object – an image node for SE (UCHAR type)
ox – x coordinate
oy – y coordinate
oz – z coordinate
tr_flag – optional parameter (0 or 1)
- morphoDilateDiamond()
Output the dilation of im using the elementary diamond shaped SE.
Its origin is set at coordinates (x,y).
Modifies the instance on which the method was called.
- morphoDilateLine(dx: int, dy: int, k: int, o: int, type: int = 0)
Output the dilation of im.
Uses the line SE with slope dy/dx, length k, origin o, and line type (see details at [SBJ96]).
Modifies the instance on which the method was called.
- Parameters:
dx – integer for displacement along x-axis to set slope
dy – integer for displacement along y-axis to set slope
k – integer for number of pixels of line SE
o – integer for origin of SE
type – integer for line type (0 for plain and 1 for periodic). 0 is the default value
- morphoErode(sec_jim_object, ox: float, oy: float, oz: float, tr_flag: bool = 0)
Output the erosion of im using the SE defined by imse.
Its origin is set at coordinates (x,y,z). The reflection of the SE is considered if trflag equals 1 (no reflection by default). Points of the SE are points with a non zero value in imse.
Modifies the instance on which the method was called.
- Parameters:
sec_jim_object – an image node for SE (UCHAR type)
ox – x coordinate
oy – y coordinate
oz – z coordinate
tr_flag – optional parameter (0 or 1)
- morphoErodeDiamond()
Output the erosion of im using the elementary diamond shaped SE.
Its origin is set at coordinates (x,y).
Modifies the instance on which the method was called.
- morphoErodeLine(dx: int, dy: int, k: int, o: int, type: bool = 0)
Output the erosion of im using a line segment.
Uses the line SE with slope dy/dx, length k, origin o, and line type. See details at [SBJ96].
Modifies the instance on which the method was called.
- Parameters:
dx – integer for displacement along x-axis to set slope
dy – integer for displacement along y-axis to set slope
k – integer for number of pixels of line SE (must be odd; if not, it is extended by one pixel)
o – integer for origin of SE
type – integer for line type (0 for plain and 1 for periodic). 0 is the default value
- morphoGradientByDilationDiamond()
Output the gradient by dilation of Jim.
Uses the elementary diamond shaped SE.
Modifies the instance on which the method was called.
- morphoGradientByErosionDiamond()
Output the gradient by erosion of Jim.
Uses the elementary diamond shaped SE.
Modifies the instance on which the method was called.
- savgolay(nl: int = None, nr: int = None, ld: int = None, m: int = None, **kwargs)
Compute the Savitzky-Golay filter in the time-spectral domain.
- Parameters:
nl – Number of leftward (past) data points used in Savitzky- Golay filter)
nr – Number of rightward (future) data points used in Savitzky- Golay filter)
ld – order of the derivative desired in Savitzky-Golay filter (e.g., ld=0 for smoothed function)
m – order of the smoothing polynomial in Savitzky-Golay filter, also equal to the highest conserved moment; usual values are m=2 or m=4)
Example:
Perform a Savitzky-Golay filter to reconstruct a time series data set as in J. Chen 2004:
jim = pj.Jim('/path/to/multi-band/image.tif', band2plane=True)
jim.pixops.convert('GDT_Float64')

savgol = pj.ngbops.savgolay(jim, nl=7, nr=7, m=2, pad='replicate')
for loop in range(0, 10):
    savgol.pixops.convert(otype=jim.properties.getDataType())
    savgol[savgol < jim] = jim
    savgol = pj.ngbops.savgolay(savgol, nl=4, nr=4, m=6,
                                pad='replicate')
- smoothNoData1d(nodata=0, interpolation_type: str = None, **kwargs)
Smooth nodata in spectral/temporal domain.
- Parameters:
nodata – no data value to interpolate
interpolation_type – type of interpolation for spectral filtering (see https://www.gnu.org/software/gsl/doc/html/interp.html)
Example:
jim = pj.Jim('/path/to/multi-band/image.tif', band2plane=True)
jim.pixops.convert('GDT_Float64')

jim.ngbops.smoothNoData1d(0)
Geometry operations
Geometry operation functions
Module for operations working with the geometry of the Jim objects.
- geometry.append(jvec1, jvec2, output: str, **kwargs)
Append JimVect object with another JimVect object.
- Parameters:
jvec1 – first JimVect object to append
jvec2 – second JimVect object to append
output – output filename of JimVect object that is returned. Use /vsimem for in memory vectors
Example: append two vectors:
v1 = pj.JimVect('/path/to/vector1.sqlite')
v2 = pj.JimVect('/path/to/vector2.sqlite')
v3 = pj.geometry.append(v1, v2, '/tmp/test.sqlite', oformat='SQLite',
                        co=['OVERWRITE=YES'])
- geometry.band2plane(jim_object)
Convert 2-dimensional multi-band object to a 3-dimensional.
The result will be a single band multi-plane object
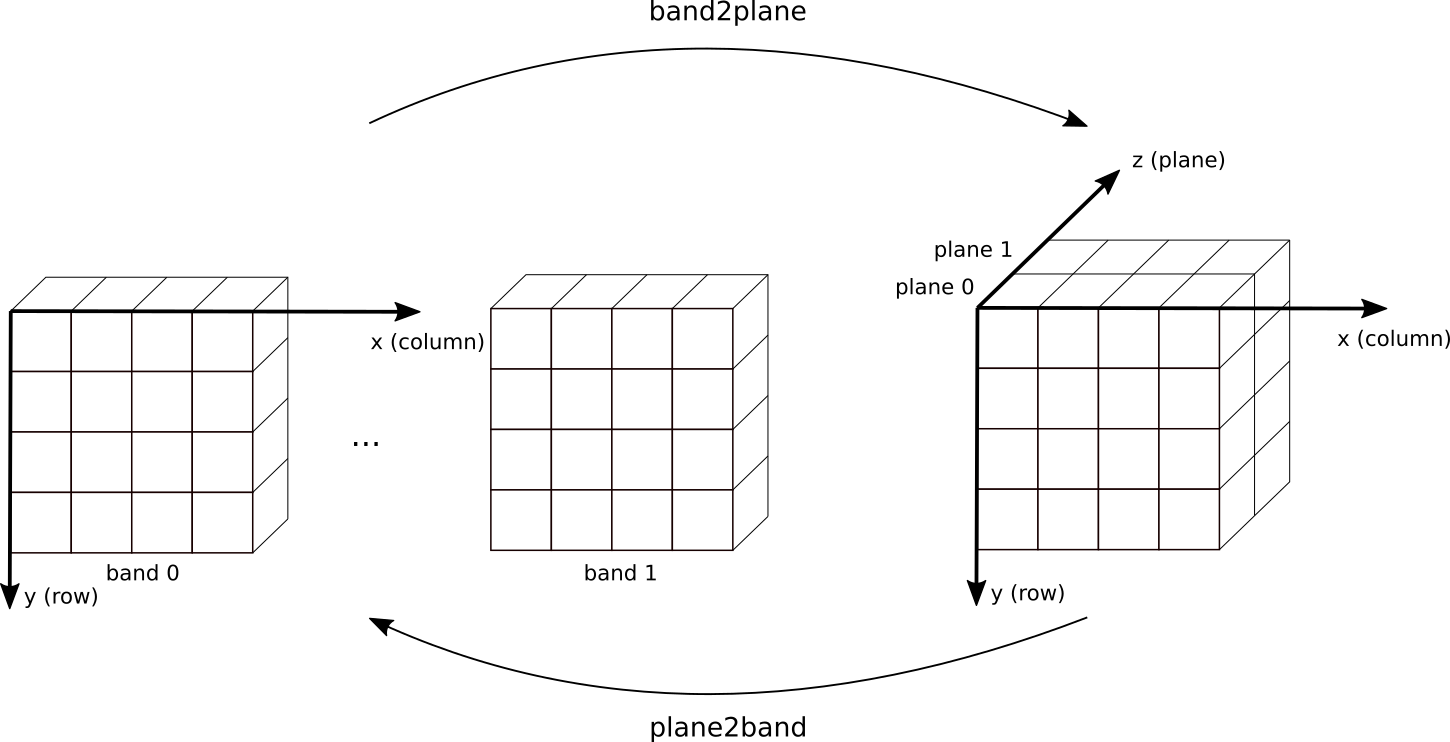
Example: convert a multi-band object with 12 bands to a 3-dimensional single band object with 12 planes:
jim2d = pj.Jim('/path/to/multi/band/image.tif')
Check the dimensions:
print(jim2d.properties.nrOfBand())
print(jim2d.properties.nrOfPlane())
output:
12
1
Convert the multi-band object to multi-plane object:
jim3d = pj.geometry.band2plane(jim2d)
Check the dimensions:
print(jim2d.properties.nrOfBand())
print(jim2d.properties.nrOfPlane())
output:
1
12
Notice that a multi-band image can also be read directly as a multi-plane object:
jim3d = pj.Jim('/path/to/multi/band/image.tif', band2plane=True)
Check the dimensions:
print(jim3d.properties.nrOfBand())
print(jim3d.properties.nrOfPlane())
output:
1
12
- geometry.convexHull(jim_vect, output: str, **kwargs)
Create the convex hull on a JimVect object.
- Parameters:
jim_vect – JimVect object to be used for the hull generation
output – output filename of JimVect object that is returned. Use /vsimem for in memory vectors
kwargs – See table below
key
value
oformat
Output vector dataset format
co
Creation option for output vector dataset
- geometry.covers(jim_object, bbox: list = None, ulx: float = None, uly: float = None, lrx: float = None, lry: float = None, coverType: str = 'ALL_TOUCHED', **kwargs)
Check if Jim object covers bounding box
- Parameters:
jim_object – a Jim object
bbox – bounding box (instead of ulx, uly, lrx, lry)
ulx – Upper left x value of bounding box to crop
uly – Upper left y value of bounding box to crop
lrx – Lower right x value of bounding box to crop
coverType – ‘ALL_TOUCHED’ (default) or ‘ALL_COVERED’
- Returns:
True if Jim object covers bounding box, else False
see
covers()for an example how to use this function
- geometry.crop(jim_object, bbox: list = None, ulx: float = None, uly: float = None, lrx: float = None, lry: float = None, dx: float = None, dy: float = None, align: bool = False, **kwargs)
Subset raster dataset.
Subset raster dataset according in spatial (subset region) domain
- Parameters:
jim_object – a Jim object
bbox – bounding box (instead of ulx, uly, lrx, lry)
ulx – Upper left x value of bounding box to crop
uly – Upper left y value of bounding box to crop
lrx – Lower right x value of bounding box to crop
lry – Lower right y value of bounding box to crop
dx – spatial resolution in x to crop (stride if nogeo is True)
dy – spatial resolution in y to crop (stride if nogeo is True)
align – align to original pixels
kwargs – See table below
- Returns:
Cropped image as Jim instance
key
value
resample
Resample algorithm used for reading pixel data in case of interpolation (default: near). Check GDAL link for available options.
nodata
Nodata value to put in image if out of bounds
see
crop()for an example how to use this function
- geometry.cropBand(jim_object, band)
Subset raster dataset.
Subset raster dataset in spectral domain.
- Parameters:
jim_object – a Jim object
band – List of band indices to crop (index is 0 based) or band name(s)
- Returns:
Cropped image as Jim instance
Example:
Crop the first three bands from raster dataset jim:
jim = pj.Jim('/path/to/raster.tif')
jim3 = pj.geometry.cropBand(jim, band=[0, 1, 2])
- geometry.cropOgr(jim_object, extent, **kwargs)
Subset raster dataset.
Subset raster dataset in spatial domain defined by a vector dataset.
- Parameters:
jim_object – a Jim object
extent – Get boundary from extent from polygons in vector file
kwargs – See table below
key
value
ln
Layer name of extent to crop
eo
Special extent options controlling rasterization
crop_to_cutline
The outside area will be set to no data (the value defined by the key ‘nodata’)
crop_in_cutline
The inside area will be set to no data (the value defined by the key ‘nodata’)
dx
Output resolution in x (default: keep original resolution)
dy
Output resolution in y (default: keep original resolution)
nodata
Nodata value to put in image if out of bounds
align
Align output bounding box to input image
Note
Possible values for the key ‘eo’ are:
ATTRIBUTE|CHUNKYSIZE|ALL_TOUCHED|BURN_VALUE_FROM|MERGE_ALG.
- For instance you can use ‘eo’:’ATTRIBUTE=fieldname’ to burn
the (numeric) fieldname in the pixel value’
- geometry.cropPlane(jim_object, plane: int)
Subset raster dataset.
Subset raster dataset in temporal domain.
- Parameters:
jim_object – a Jim object
plane – List of plane indices to crop (index is 0 based)
- Returns:
Cropped image as Jim instance
Example:
Crop the first three planes from raster dataset jim:
jim = pj.Jim('/path/to/raster.tif')
jim3 = pj.geometry.cropPlane(jim, plane=[0, 1, 2])
- geometry.extract(jvec, jim, output: str, rule: str = None, **kwargs)
Extract pixel values from raster image based on a vector dataset.
- Parameters:
jvec – overlay JimVec object or Jim thematic raster
jim – Jim object (list) on which vector is overlaid to extract from
rule – Rule how to calculate zonal statistics per feature (see list of supported rules)
output – Name of the output vector dataset in which the zonal statistics will be saved
kwargs – See table below
- Returns:
A JimVect with the same geometry as the sample vector dataset and an extra field for each of the calculated raster value (zonal) statistics. The same layer name(s) of the sample will be used for the output vector dataset
key
value
copy
Copy these fields from the sample vector dataset (default is to copy all fields)
label
Create extra field named ‘label’ with this value
classes
Only when overlaying Jim thematic raster dataset dataset.
cover
Which polygons to include based on coverage (ALL_TOUCHED, ALL_COVERED), default ALL_TOUCHED
bandname
List of band names corresponding to list of bands to extract
planename
List of plane names corresponding to list of planes to extract
oformat
Output vector dataset format
co
Creation option for output vector dataset
Note
To ignore some pixels from the extraction process, see list of mask key values
Example:
Extract the mean value of the pixels within the polygon of the provided reference vector. Exclude the pixels within a buffer of 10m of the polygon boundary. Use a temporary vector in memory for the calculation. Then write the result to the final destination on disk:
reference = pj.JimVect('/path/to/reference.sqlite')
jim0 = pj.Jim('/path/to/raster.tif')
v = reference.geometry.extract(jim0,
    buffer=-10, rule=['mean'],
    output='/vsimem/temp.sqlite', oformat='SQLite')
v.io.write('/path/to/output.sqlite)
Open a raster sample dataset based on land cover map (e.g., Corine) and use it to extract a stratified sample of 100 points from an input raster dataset with four spectral bands (‘B02’, ‘B03’, ‘B04’, ‘B08’). Only sample classes 2 (urban), 12 (agriculture), 25 (forest), 41 (water) and an aggregated (rest) class 50:
reference = pj.Jim('/path/to/landcovermap.tif')

classes = [2, 12, 25, 41, 50]
thresholds = ['20%', '25%', '25%', '10%', '5%']

jim = pj.Jim('/path/to/s2_multiband.tif')

outputfn = '/path/to/output.sqlite'
sample = pj.geometry.extract(reference,
                             jim,
                             srcnodata=[0],
                             output=outputfn,
                             classes=classes,
                             threshold=thresholds,
                             bandname=['B02', 'B03', 'B04', 'B08'])
- geometry.geo2image(jim_object, x: float, y: float)
Convert georeferenced coordinates to image coordinates (col, row).
- Parameters:
jim_object – a Jim object
x – georeferenced coordinate in x according to the object spatial reference system
y – georeferenced coordinate in y according to the object spatial reference system
- Returns:
image coordinates (row and column, starting from 0)
Get column and row index (0 based) of some georeferenced coordinates x and y (in this case first pixel: 0, 0):
jim = pj.Jim('/path/to/raster.tif')
x = jim.properties.getUlx()
y = jim.properties.getUly()
pj.geometry.geo2image(jim, x, y)
- geometry.image2geo(jim_object, i: int, j: int)
Convert image coordinates (col, row) to georeferenced coordinates.
- Parameters:
jim_object – a Jim object
i – image column number (starting from 0)
j – image row number (starting from 0)
- Returns:
georeferenced coordinates according to the object spatial reference system
Get upper left corner in georeferenced coordinates (in SRS of the Jim object):
jim = pj.Jim('/path/to/raster.tif')
pj.geometry.image2geo(jim, 0, 0)
- geometry.imageFrameSubtract(jim_object, l: int = 0, r: int = 0, t: int = 0, b: int = 0, u: int = 0, d: int = 0)
Subtract an image frame.
- Parameters:
jim_object – a Jim object
l – width of left frame
r – width of right frame
t – width of top frame
b – width of bottom frame
u – width of upper frame
d – width of lower frame
- Returns:
a Jim object
- geometry.intersect(jvec, jim, output: str, **kwargs)
Intersect JimVect object with Jim object.
Return only those features with an intersect
- Parameters:
jvec – JimVect object to intersect
jim – Jim object with which to intersect
output – output filename of JimVect object that is returned. Use /vsimem for in memory vectors
kwargs – See table below
- Returns:
intersected JimVect object
key
value
oformat
Output vector dataset format
co
Creation option for output vector dataset
Example: intersect a sample with a Jim object:
jim = pj.Jim('/path/to/raster.tif')
v = pj.JimVect('/path/to/vector.sqlite')
sampleintersect = pj.geometry.intersect(
    v, jim, output='/vsimem/intersect', oformat='SQLite',
    co=['OVERWRITE=YES'])
sampleintersect.io.write('/path/to/output.sqlite')
- geometry.join(jvec1, jvec2, output: str, **kwargs)
Join JimVect object with another JimVect object.
A key field is used to find corresponding features in both objects.
- Parameters:
jvec1 – first JimVect object to join
jvec2 – second JimVect object to join
output – output filename of JimVect object that is returned. Use /vsimem for in memory vectors
kwargs – See table below
- Returns:
joined JimVect object
key
value
key
Key(s) used to join (default is fid)
method
Join method: “INNER”,”OUTER_LEFT”,”OUTER_RIGHT”, “OUTER_FULL”. (default is INNER)
oformat
Output vector dataset format
co
Creation option for output vector dataset
The join methods currently supported are:
- INNER
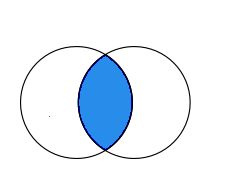 :
: join two JimVect objects, keeping only those features for which identical keys in both objects are found
- OUTER_LEFT
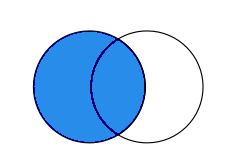 :
: join two JimVect objects, keeping all features from first object
- OUTER_RIGHT
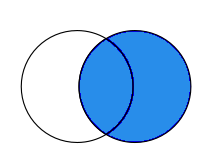 :
: join two JimVect objects, keeping all features from second object
- OUTER_FULL
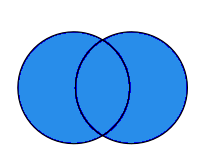 :
: join two JimVect objects, keeping all features from both objects
Example: join two vectors, based on the key ‘id’, which is a common field shared between v1 and v2. Use OUTER_FULL as the join method:
v1 = pj.JimVect('/path/to/vector1.sqlite')
v2 = pj.JimVect('/path/to/vector2.sqlite')
v3 = pj.geometry.join(
    v1, v2, '/tmp/test.sqlite', oformat='SQLite',
    co=['OVERWRITE=YES'], key=['id'], method='OUTER_FULL')
- geometry.plane2band(jim_object)
Convert 3-dimensional 1-band Jim to a 2-dimensional multi-band one. :param jim_object: a Jim object :return: a multi-band Jim object with planes converted to bands
The result will be a multi-band single plane object
Example: convert a single band object with 12 planes to a 2-dimensional multi-band object with 1 plane:
jim3d = pj.Jim('/path/to/multi/band/image.tif', band2plane=True)
Check the dimensions:
print(jim3d.properties.nrOfBand())
print(jim3d.properties.nrOfPlane())
output:
1
12
Convert the multi-plane object to multi-band object:
jim2d = pj.geometry.plane2band(jim3d)
Check the dimensions:
print(jim2d.properties.nrOfBand())
print(jim2d.properties.nrOfPlane())
output:
12
1
- geometry.plotLine(jim_object, x1: float, y1: float, x2: float, y2: float, val: float)
Draw a line from [x1, y1] to [x2, y2] by setting pixels of Jim to val.
Works only for 1-plane Jims.
- Parameters:
jim_object – a Jim object
x1 – an integer for x-coordinate of 1st point
y1 – an integer for y-coordinate of 1st point
x2 – an integer for x-coordinate of 2nd point
y2 – an integer for y-coordinate of 2nd point
val – value to be used for line pixels
- Returns:
a Jim object
- geometry.polygonize(jim_object, output: str, **kwargs)
Polygonize Jim object based on GDALPolygonize.
- Parameters:
jim_object – a Jim object
output – output filename of JimVect object that is returned. Use /vsimem for in memory vectors
kwargs – See table below
- Returns:
JimVect object with polygons
key
value
ln
Output layer name
oformat
Output vector dataset format
co
Creation option for output vector dataset
name
Field name of the output layer (default is DN)
nodata
Disgard this nodata value when creating polygons
mask
mask with identical geometry as input raster object (zero is invalid, non-zero is valid)
- geometry.rasterize(jim_object, jim_vect, burn_value: int = 1, eo: list = None, ln: str = None)
Rasterize Jim object based on GDALRasterizeLayersBuf.
- Parameters:
jim_object – a template Jim object
jim_vect – JimVect object that needs to be rasterized
burn_value – burn value
eo – option (default is ALL_TOUCHED)
ln – layer names (optional)
- Returns:
rasterized Jim object
Note
Possible values for the key ‘eo’ are:
ATTRIBUTE|CHUNKYSIZE|ALL_TOUCHED|BURN_VALUE_FROM|MERGE_ALG.
For instance you can use ‘eo’:’ATTRIBUTE=fieldname to burn the (numeric) fieldname in the pixel value’
- geometry.reducePlane(jim, rule='overwrite', ref_band: int = None, nodata: float = None, **kwargs)
Reduce planes of Jim object.
- Parameters:
jim – jim object on which to reduce planes
rule – rule to reduce (mean, median, quantile, min or max) or callback function
ref_band – band on which to apply rule (default is to check all bands, not supported when rule is callback function)
nodata – value to ignore when applying rule (not supported when rule is callback function)
- Returns:
reduced single plane jim object
- geometry.repeat(jim_object, n: int, axis: int)
repeat as in Numpy
- Parameters:
jim_object – a Jim object
n – a positive integer for repeating pixels
axis – starting from 0 (plane for 3D image, or row for 2D image)
- Returns:
a Jim object containing the magnified image
- geometry.sample(jim_object, output: str, **kwargs)
Extract a random or grid sample from a raster dataset.
- Parameters:
jim_object – Jim object to sample (multi-band supported, but multi-plane not yet)
output – Name of the output vector dataset in which the zonal statistics will be saved
output – path to the output
kwargs – See table below
- Returns:
A JimVect with sample
key
value
random
Extract a random sample with a size equal to the defined value
grid
Extract a grid sample with a grid size equal to the defined value
rule
Rule how to calculate zonal statistics per feature (see list of supported rules)
buffer
Buffer for calculating statistics for point features (in geometric units of raster dataset)
label
Create extra field named ‘label’ with this value
band
List of bands to extract (0 indexed). Default is to use extract all bands
bandname
List of band name corresponding to list of bands to extract
startband
Start band sequence number (0 indexed)
endband
End band sequence number (0 indexed)
ln
Layer name of output vector dataset
oformat
Output vector dataset format
co
Creation option for output vector dataset
Note
To ignore some pixels from the extraction process, see list of mask key values:
Example:
Extract a random sample of 100 points, calculating the mean value based on a 3x3 window (buffer value of 100 m) in a vector dataset in memory:
v01 = jim0.sample(random=100, buffer=100, rule=['mean'],
                  output='mem01', oformat='Memory')
Extract a sample of 100 points using a regular grid sampling scheme. For each grid point, calculate the median value based on a 3x3 window (buffer value of 100 m neighborhood). Write the result in a SQLite vector dataset on disk:
outputfn = '/path/to/output.sqlite'
npoint = 100
gridsize = int(jim.nrOfCol()*jim.getDeltaX()/math.sqrt(npoint))
v = jim.sample(grid=gridsize, buffer=100, rule=['median'],
               output=outputfn, oformat='SQLite')
- geometry.stackBand(jim_object, jim_other=None, band=None)
Stack bands from raster datasets into new multiband Jim object.
- Parameters:
jim_object – a Jim or JimList object used for stacking the bands
jim_other – a Jim object or jimlist from which to copy bands (optional)
band – List of band indices to stack (index is 0 based) or band name. Default is to stack all bands.
- Returns:
Jim object with stacked bands
Append all the bands of jim1 to jim0:
jim0 = pj.Jim('/path/to/raster0.tif')
jim1 = pj.Jim('/path/to/raster1.tif')
jim_stacked = pj.geometry.stackBand(jim0, jim1)
Stack all bands of the JimList, returning a multi-band Jim object:
jim0 = pj.Jim('/path/to/raster0.tif')
jim1 = pj.Jim('/path/to/raster1.tif')
jimlist = pj.JimList([jim0, jim1])
jim_stacked = pj.geometry.stackBand(jimlist)
Append the first three bands of raster dataset jim1 to the image jim0:
jim0 = pj.Jim('/path/to/raster0.tif')
jim1 = pj.Jim('/path/to/raster1.tif')
jim_stacked = pj.geometry.stackBand(jim0, jim1, band=[0, 1, 2])
- geometry.stackPlane(jim_object, jim_other=None, *args)
Stack planes from raster datasets into new multiplane Jim object.
- Parameters:
jim_object – a Jim or JimList object used for stacking the planes
jim_other – a Jim object or jimlist from which to copy planes (optional)
- Returns:
Jim object with stacked planes
Append all the planes of jim1 to jim0:
jim0 = pj.Jim('/path/to/raster0.tif')
jim1 = pj.Jim('/path/to/raster1.tif')
jim_stacked = pj.geometry.stackPlane(jim0, jim1)
Stack all planes of the JimList, returning a multi-plane Jim object:
jim0 = pj.Jim('/path/to/raster0.tif')
jim1 = pj.Jim('/path/to/raster1.tif')
jimlist = pj.JimList([jim0, jim1])
jim_stacked = pj.geometry.stackPlane(jimlist)
- geometry.warp(jim_object, t_srs=None, bbox: list = None, ulx: float = None, uly: float = None, lrx: float = None, lry: float = None, dx: float = None, dy: float = None, **kwargs)
Warp a raster dataset to a target spatial reference system.
- Parameters:
jim_object – a Jim or JimVect object
t_srs – Target spatial reference system
bbox – bounding box (instead of ulx, uly, lrx, lry)
ulx – Upper left x value of bounding box
uly – Upper left y value of bounding box
lrx – Lower right x value of bounding box
lry – Lower right y value of bounding box
dx – spatial resolution in x (only for Jim object)
dy – spatial resolution in y (only for Jim object)
kwargs – See table below (only for Jim object)
- Returns:
warped object
key
value
s_srs
Source spatial reference system (default is to read from input)
resample
Resample algorithm used for reading pixel data in case of interpolation (default: near). Check GDAL link for available options.
nodata
Nodata value to put in image if out of bounds
Example Jim:
Read a raster dataset from disk and warp to the target spatial reference system:
jim = pj.Jim('/path/to/file.tif')
jim_warped = pj.geometry.warp(jim, 'epsg:3035')
Read a raster dataset from disk that is in lat lon (epsg:4326), select a bounding box in a different spatial reference system (epsg:3035). Notice the raster dataset read is still in the original projection (epsg:4326). Then warp the raster dataset to the target spatial reference system (epsg:3035):
jim = pj.Jim('/path/to/file.tif', t_srs='epsg:3035', ulx=1000000,
             uly=4000000, lrx=1500000, lry=3500000)
jim_warped = pj.geometry.warp(jim, 'epsg:3035', s_srs='epsg:4326')
Example JimVect:
Read a vector dataset from disk and warp to epsg:4326. Retain only those features within the defined bounding box:
v = pj.JimVect('/path/to/vector.sqlite')
v_warped = pj.geometry.warp(v, t_srs = 'epsg:4326',
                            ulx = 9.8, uly = 45.8,
                            lrx = 10.2, lry = 45.5)
Geometry operation methods on Jim
- class geometry._Geometry
Define all Geometry methods.
- band2plane()
Convert 2-dimensional multi-band object to a 3-dimensional.
The result will be a single band multi-plane object
Example: convert a multi-band object with 12 bands to a 3-dimensional single band object with 12 planes:
jim = pj.Jim('/path/to/multi/band/image.tif')
Check the dimensions:
print(jim.properties.nrOfBand())
print(jim.properties.nrOfPlane())
output:
12
1
Convert the multi-band object to multi-plane object:
jim = pj.geometry.band2plane(jim)
Check the dimensions:
print(jim.properties.nrOfBand())
print(jim.properties.nrOfPlane())
output:
1
12
Notice that a multi-band image can also be read directly as a multi-plane object:
jim = pj.Jim('/path/to/multi/band/image.tif', band2plane=True)
Check the dimensions:
print(jim.properties.nrOfBand())
print(jim.properties.nrOfPlane())
output:
1
12
- covers(bbox: list = None, ulx: float = None, uly: float = None, lrx: float = None, lry: float = None, coverType: str = 'ALL_TOUCHED', **kwargs)
Check if Jim object covers bounding box
- Parameters:
jim_object – a Jim object
bbox – bounding box (instead of ulx, uly, lrx, lry)
ulx – Upper left x value of bounding box to crop
uly – Upper left y value of bounding box to crop
lrx – Lower right x value of bounding box to crop
lry – Lower right y value of bounding box to crop
coverType – ‘ALL_TOUCHED’ (default) or ‘ALL_COVERED’
- Returns:
True if Jim object covers bounding box, else False
Example: check if Jim (for instance in lat lon coordinates) covers a bounding box:
jim = pj.Jim('/path/to/image.tif')
ulx = 2
uly = 58
lrx = 4
lry = 56
if jim.geometry.covers(bbox = [ulx, uly, lrx, lry]):
    print("jim covers your bounding box")
else:
    print("jim does not cover your bounding box")
- crop(bbox: list = None, ulx: float = None, uly: float = None, lrx: float = None, lry: float = None, dx: float = None, dy: float = None, align: bool = False, **kwargs)
Subset raster dataset.
Subset raster dataset according in spatial (subset region) domain
- Parameters:
bbox – bounding box (instead of ulx, uly, lrx, lry)
ulx – Upper left x value of bounding box to crop
uly – Upper left y value of bounding box to crop
lrx – Lower right x value of bounding box to crop
lry – Lower right y value of bounding box to crop
dx – spatial resolution in x to crop (stride if nogeo is True)
dy – spatial resolution in y to crop (stride if nogeo is True)
align – align to original pixels
kwargs – See table below
key
value
resample
Resample algorithm used for reading pixel data in case of interpolation (default: near). Check GDAL link for available options.
nodata
Nodata value to put in image if out of bounds
Example:
Crop bounding box in georeferenced coordinates:
jim = pj.Jim('/path/to/raster.tif')
jim.crop(ulx=1000000, uly=5000000, lrx=2000000, lry=4000000,
         dx=1000, dy=1000)
Crop bounding box in image coordinates (starting from upper left pixel coordinate 0, 0). For instance, get first 10 columns in first 10 rows:
jim = pj.Jim('/path/to/raster.tif')
jim.crop(ulx=0, uly=0, lrx=10, lry=10, nogeo=True)
Notice that for this case, a more pythonic way to is available via Indexing: get and set Jim items:
jim0[0:10, 0:10]
However, crop can also be used to enlarge a Jim object. For instance, to add a border of one pixel use:
jim = pj.Jim('/path/to/raster.tif')
jim.geometry.crop(ulx=-1, uly=-1, lrx=jim.properties.nrOfCol()+1,
                  lry=jim.properties.nrOfRow()+1, nogeo=True)
- cropBand(band)
Subset raster dataset.
Subset raster dataset in spectral domain.
Modifies the instance on which the method was called.
- Parameters:
band – List of band indices to crop (index is 0 based) or band name(s)
Example:
Crop the first three bands from raster dataset jim0:
jim0 = pj.Jim('/path/to/raster0.tif')
jim0.cropBand(band=[0, 1, 2])
- cropOgr(extent, **kwargs)
Subset raster dataset.
Subset raster dataset in spatial domain defined by a vector dataset.
Modifies the instance on which the method was called.
- Parameters:
extent – Get boundary from extent from polygons in vector file
kwargs – See table below
key
value
ln
Layer name of extent to crop
eo
Special extent options controlling rasterization
crop_to_cutline
The outside area will be set to no data (the value defined by the key ‘nodata’)
crop_in_cutline
The inside area will be set to no data (the value defined by the key ‘nodata’)
dx
Output resolution in x (default: keep original resolution)
dy
Output resolution in y (default: keep original resolution)
nodata
Nodata value to put in image if out of bounds
align
Align output bounding box to input image
Note
Possible values for the key ‘eo’ are:
ATTRIBUTE|CHUNKYSIZE|ALL_TOUCHED|BURN_VALUE_FROM|MERGE_ALG.
For instance you can use ‘eo’:’ATTRIBUTE=fieldname’ to burn the (numeric) fieldname in the pixel value’
- cropPlane(plane)
Subset raster dataset.
Subset raster dataset in temporal domain.
Modifies the instance on which the method was called.
- Parameters:
plane – List of plane indices to crop (index is 0 based)
Example:
Crop the first three planes from raster dataset jim0:
jim0 = pj.Jim('/path/to/raster0.tif')
jim0.cropPlane(plane=[0, 1, 2])
- geo2image(x: float, y: float)
Convert georeferenced coordinates to image coordinates (col, row).
- Parameters:
x – georeferenced coordinate in x according to the object spatial reference system
y – georeferenced coordinate in y according to the object spatial reference system
- Returns:
image coordinates (row and column, starting from 0)
Get column and row index (0 based) of some georeferenced coordinates x and y (in this case first pixel: 0, 0):
jim = pj.Jim('/path/to/raster.tif')
x = jim.properties.getUlx()
y = jim.properties.getUly()
jim.geometry.geo2image(x, y)
- image2geo(i: int, j: int)
Convert image coordinates (col, row) to georeferenced coordinates.
- Parameters:
i – image column number (starting from 0)
j – image row number (starting from 0)
- Returns:
georeferenced coordinates according to the object spatial reference system
Get upper left corner in georeferenced coordinates (in SRS of the Jim object):
jim = pj.Jim('/path/to/raster.tif')
jim.geometry.image2geo(0, 0)
- imageFrameSubtract(l: int = 0, r: int = 0, t: int = 0, b: int = 0, u: int = 0, d: int = 0)
Subtract an image frame.
Modifies the instance on which the method was called.
- Parameters:
l – width of left frame
r – width of right frame
t – width of top frame
b – width of bottom frame
u – width of upper frame
d – width of lower frame
- plane2band()
Convert 3-dimensional 1-band Jim to a 2-dimensional multi-band one.
The result will be a multi-band single plane object
Example: convert a single band object with 12 planes to a 2-dimensional multi-band object with 1 plane:
jim = pj.Jim('/path/to/multi/band/image.tif', band2plane=True)
Check the dimensions:
print(jim.properties.nrOfBand())
print(jim.properties.nrOfPlane())
output:
1
12
Convert the multi-plane object to multi-band object:
jim.geometry.plane2band()
Check the dimensions:
print(jim.properties.nrOfBand())
print(jim.properties.nrOfPlane())
output:
12
1
- plotLine(x1: int, y1: int, x2: int, y2: int, val: float)
Draw a line from [x1, y1] to [x2, y2] by setting pixels to a value.
Works only for 1-plane Jims.
Modifies the instance on which the method was called.
- Parameters:
x1 – an integer for x-coordinate of 1st point
y1 – an integer for y-coordinate of 1st point
x2 – an integer for x-coordinate of 2nd point
y2 – an integer for y-coordinate of 2nd point
val – value to be used for line pixels
- polygonize(output: str, **kwargs)
Polygonize Jim object based on GDALPolygonize.
Returns a new JimVect object.
- Parameters:
output – output filename of JimVect object that is returned. Use /vsimem for in memory vectors
kwargs – See table below
- Returns:
JimVect object with polygons
key
value
ln
Output layer name
oformat
Output vector dataset format
co
Creation option for output vector dataset
name
Field name of the output layer (default is DN)
nodata
Discard this nodata value when creating polygons
mask
mask with identical geometry as input raster object (zero is invalid, non-zero is valid)
Example: create a polygon vector file from a Sentinel-2 classification raster dataset, where clouds are represented by the pixel value 9:
sclfn = 'T33UUT_20180701T102021_SCL_20m.jp2'
sclJim = pj.Jim(sclfn)
sclJim[sclJim != 9] = 0
sclJim[sclJim == 9] = 1
vcloud = sclJim.geometry.polygonize('/vsimem/cloud.sqlite',
                                    name='cloud', nodata=0)
vcloud.io.write('/path/to/cloud.sqlite')
- rasterize(jim_vect, burn_value: int = 1, eo: list = None, ln: str = None)
Rasterize Jim object based on GDALRasterizeLayersBuf.
- Parameters:
jim_vect – JimVect object that needs to be rasterized
burn_value – burn value
eo – option (default is ALL_TOUCHED)
ln – layer names (optional)
Note
Possible values for the key ‘eo’ are:
ATTRIBUTE|CHUNKYSIZE|ALL_TOUCHED|BURN_VALUE_FROM|MERGE_ALG.
For instance you can use ‘eo’:’ATTRIBUTE=fieldname to burn the (numeric) fieldname in the pixel value’
Example: rasterize vector using the label attribute by creating first a mask from an existing raster that will be used as a template for the rasterize process:
jim0 = pj.Jim(rasterfn, band=0)
sample = pj.JimVect(vectorfn)
mask = pj.Jim(jim0, copy_data=False)
mask.pixops.convert('GDT_Byte')
mask.geometry.rasterize(sample, eo=['ATTRIBUTE=label'])
If no raster template exists, a new Jim object can be created, using the geometry of the JimVect. For instance, to rasterize the GeoJSON:
jsonstring =
  '{"polygons": '
  '{"type": "FeatureCollection", '
      '"crs": '
          '{"type": "name", '
          '"properties": '
          '{"name": "urn:ogc:def:crs:OGC:1.3:CRS84"}}, '
      '"features": '
          '[{"type": "Feature", '
          '"properties": {"label": 1}, '
          '"geometry": '
              '{"type": "Polygon", '
              '"coordinates": '
                  '[[[ 16.296883885037882, 48.07125730037879 ], '
                  '[ 16.29418254261364, 47.787616345833342 ], '
                  '[ 16.518393963825762, 47.814629770075761 ], '
                  '[ 16.413041609280306, 48.04424387613637 ], '
                  '[ 16.296883885037882, 48.07125730037879 ]]'
  ']}}]}}'

v = pj.JimVect(jsonstring)
jim = pj.Jim(bbox = v.properties.getBBox(), a_srs='epsg:4326',
             otype='GDT_Byte', dx=0.001, dy=0.001)
jim.geometry.rasterize(v)
Note
The spatial resolution in x and y must set in decimal degrees when the projection is set to lat/lon (epsg:4326)
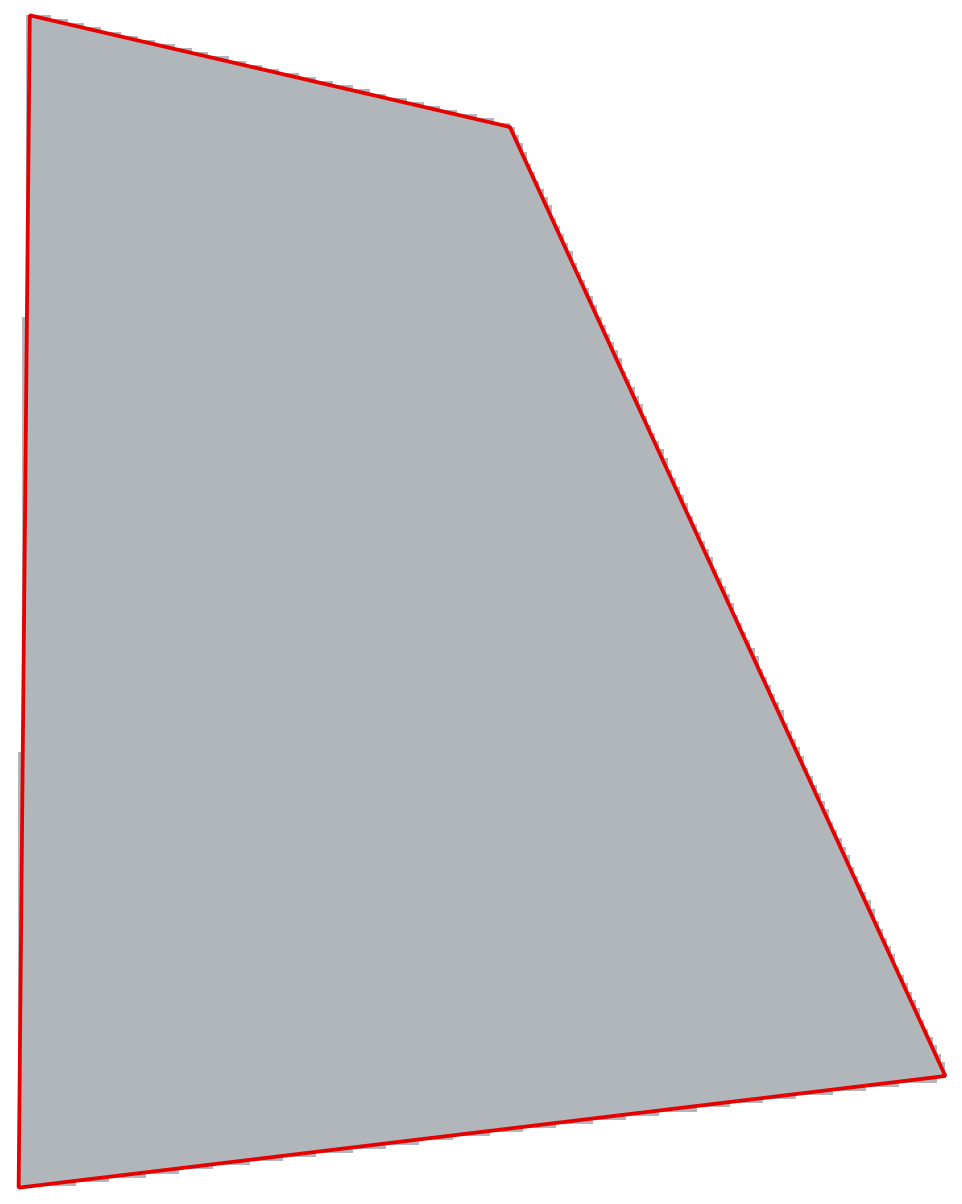
- reducePlane(rule='overwrite', ref_band: int = None, nodata: float = None, **kwargs)
Reduce planes of Jim object.
- Parameters:
rule – rule to reduce (mean, median, min or max) or callback function
ref_band – band on which to apply rule (default is to check all bands, not supported when rule is callback function)
nodata – value to ignore when applying rule (not supported when rule is callback function)
Stack planes of two single plane jim objects, then reduce by taking the means:
jim0 = pj.Jim('/path/to/raster0.tif')
jim1 = pj.Jim('/path/to/raster1.tif')
jim_stacked = pj.geometry.stackPlane(jim0, jim1)
jim_stacked.geometry.reducePlane('mean')
Stack planes of two single plane jim objects, then reduce by taking the maximum using callback function:
jim0 = pj.Jim('/path/to/raster0.tif')
jim1 = pj.Jim('/path/to/raster1.tif')
jim_stacked = pj.geometry.stackPlane(jim0, jim1)
def getMax(reduced, plane):
    return pj.pixops.supremum(reduced, plane)
jim_stacked.geometry.reducePlane(getMax)
- repeat(n: int, axis: int)
repeat as in Numpy
Modifies the instance on which the method was called.
- Parameters:
n – a positive integer for repeating pixels
axis – starting from 0 (plane for 3D image, or row for 2D image)
- stackBand(jim_other, band=None)
Stack the bands of another Jim object to the current Jim object.
Modifies the instance on which the method was called.
- Parameters:
jim_other – a Jim object or jimlist from which to copy bands
band – List of band indices to stack (index is 0 based) or band name
Example:
Append all the bands of a multiband Jim object jim1 to the current single band Jim object jim0:
jim0 = pj.Jim('/path/to/singleband.tif')
jim1 = pj.Jim('/path/to/multiband.tif')
jim0.geometry.stackBand(jim1)
Append the first three bands of raster dataset jim1 to the current Jim object jim0:
jim0 = pj.Jim('/path/to/singleband.tif')
jim1 = pj.Jim('/path/to/multiband.tif')
jim0.geometry.stackBand(jim1, band=[0, 1, 2])
- stackPlane(jim_other=None, *args)
Stack the planes of another Jim object to the current Jim object.
Modifies the instance on which the method was called.
- Parameters:
jim_other – a Jim object or jimlist from which to copy planes
Example:
Append all the planes of a multiplane Jim object jim1 to the current single plane Jim object jim0:
jim0 = pj.Jim('/path/to/singleplane.tif')
jim1 = pj.Jim('/path/to/multiplane.tif')
jim0.geometry.stackPlane(jim1)
- warp(t_srs=None, bbox: list = None, ulx: float = None, uly: float = None, lrx: float = None, lry: float = None, dx: float = None, dy: float = None, **kwargs)
Warp a raster dataset to a target spatial reference system.
- Parameters:
t_srs – Target spatial reference system
bbox – bounding box (instead of ulx, uly, lrx, lry)
ulx – Upper left x value of bounding box
uly – Upper left y value of bounding box
lrx – Lower right x value of bounding box
lry – Lower right y value of bounding box
dx – spatial resolution in x
dy – spatial resolution in y
kwargs – See table below
key
value
s_srs
Source spatial reference system (default is to read from input)
resample
Resample algorithm used for reading pixel data in case of interpolation (default: near). Check GDAL link for available options.
nodata
Nodata value to put in image if out of bounds
Example:
Read a raster dataset from disk and warp to the target spatial reference system:
jim = pj.Jim('/path/to/file.tif')
jim.geometry.warp('epsg:3035')
Read a raster dataset from disk that is in lat lon (epsg:4326), select a bounding box in a different spatial reference system (epsg:3035). Notice the raster dataset read is still in the original projection (epsg:4326). Then warp the raster dataset to the target spatial reference system (epsg:3035):
jim = pj.Jim('/path/to/file.tif', t_srs='epsg:3035',
             ulx=1000000, uly=4000000, lrx=1500000, lry=3500000)
jim.geometry.warp('epsg:3035', s_srs='epsg:4326')
Geometry operation methods on JimVect
- class geometry._GeometryVect
Define all Geometry methods for JimVects.
- append(jvec, **kwargs)
Append JimVect object with another JimVect object.
- Parameters:
jvec – JimVect object to append
- Returns:
appended JimVect object
Modifies the instance on which the method was called.
Example: append two vectors:
v1 = pj.JimVect('/path/to/vector1.sqlite')
v2 = pj.JimVect('/path/to/vector2.sqlite')
v1.geometry.append(v2, '/path/to/appended.sqlite')
- convexHull(**kwargs)
Create the convex hull on a JimVect object.
Modifies the instance on which the method was called.
- Parameters:
kwargs – See table below
key
value
co
Creation option for output vector dataset
- extract(jim, output: str, rule: str = None, **kwargs)
Extract pixel values from raster image based on a vector dataset.
- Parameters:
jim – Jim object (list) on which vector is overlaid to extract from
rule – Rule how to calculate zonal statistics per feature (see list of supported rules)
output – Name of the output vector dataset in which the zonal statistics will be saved
kwargs – See table below
- Returns:
A JimVect with the same geometry as the sample vector dataset and an extra field for each of the calculated raster value (zonal) statistics. The same layer name(s) of the sample will be used for the output vector dataset
key
value
copy
Copy these fields from the sample vector dataset (default is to copy all fields) set copy to single field if rule is ‘allpoints’
bandname
List of band names corresponding to list of bands to extract
planename
List of plane names corresponding to list of planes to extract
oformat
Output vector dataset format
co
Creation option for output vector dataset
- Supported rules to extract <extract_rules>:
rule
description
point
extract a single pixel within the polygon or on each point feature
allpoints
Extract all pixel values covered by the polygon (copy field must be set to one field)
centroid
Extract pixel value at the centroid of the polygon
mean
Extract average of all pixel values within the polygon
stdev
Extract standard deviation of all pixel values within the polygon
median
Extract median of all pixel values within the polygon
min
Extract minimum value of all pixels within the polygon
max
Extract maximum value of all pixels within the polygon
sum
Extract sum of the values of all pixels within the polygon
mode
Extract the mode of classes within the polygon (classes must be set with the option classes)
proportion
Extract proportion of class(es) within the polygon (classes must be set with the option classes)
count
Extract count of class(es) within the polygon (classes must be set with the option classes)
percentile
Extract percentile as defined by option perc (e.g, 95th percentile of values covered by polygon)
Note
To ignore some pixels from the extraction process, see list of mask key values
- Supported key values to mask pixels that must be ignored in the extraction process <extract_mask>:
key
value
srcnodata
List of nodata values not to extract
buffer
Buffer (in geometric units of raster dataset). Use neg. value to exclude pixels within buffer
bndnodata
List of band in input image to check if pixel is valid (used for srcnodata)
mask
Use the specified file as a validity mask
mskband
Use the specified band of the mask file defined
msknodata
List of mask values not to extract
threshold
Maximum number of features to extract. Use percentage value as string (e.g., ‘10%’) or integer value for absolute threshold
Example:
Extract the mean value of the pixels within the polygon of the provided reference vector. Exclude the pixels within a buffer of 10m of the polygon boundary. Use a temporary vector in memory for the calculation. Then write the result to the final destination on disk:
reference = pj.JimVect('/path/to/reference.sqlite')
jim0 = pj.Jim('/path/to/raster.tif')
reference.geometry.extract(
    jim0, buffer=-10, rule=['mean'],
    output='/vsimem/temp.sqlite', oformat='SQLite')
reference.io.write('/path/to/output.sqlite)
- intersect(jim, **kwargs)
Intersect JimVect object with Jim object.
Keeps only those features with an intersect.
Modifies the instance on which the method was called.
- Parameters:
jim – Jim object with which to intersect
Example: intersect a sample with a Jim object:
jim = pj.Jim('/path/to/raster.tif')
v = pj.JimVect('/path/to/vector.sqlite')
v.geometry.intersect(jim)
#or using a function:
# sampleintersect = pj.geometry.intersect(
#     v, jim, output='/vsimem/intersect', oformat='SQLite',
#     co=['OVERWRITE=YES'])
sampleintersect.io.write('/path/to/output.sqlite')
- join(jvec2, **kwargs)
Join JimVect object with another JimVect object.
A key field is used to find corresponding features in both objects.
Modifies the instance on which the method was called.
- Parameters:
jvec2 – second JimVect object to join
kwargs – See table below
- Returns:
joined JimVect object
key
value
key
Key(s) used to join (default is fid)
method
Join method: “INNER”,”OUTER_LEFT”,”OUTER_RIGHT”, “OUTER_FULL”. (default is INNER)
The join methods currently supported are:
- INNER :
join two JimVect objects, keeping only those features for which identical keys in both objects are found
- OUTER_LEFT :
join two JimVect objects, keeping all features from first object
- OUTER_RIGHT :
join two JimVect objects, keeping all features from second object
- OUTER_FULL :
join two JimVect objects, keeping all features from both objects
Example: join two vectors, based on the key ‘id’, which is a common field shared between v1 and v2. Use OUTER_FULL as the join method:
v1 = pj.JimVect('/path/to/vector1.sqlite')
v2 = pj.JimVect('/path/to/vector2.sqlite')
v3 = pj.geometry.join(
    v1, v2, '/tmp/test.sqlite', oformat='SQLite',
    co=['OVERWRITE=YES'], key=['id'], method='OUTER_FULL')
- warp(t_srs=None, bbox: list = None, ulx: float = None, uly: float = None, lrx: float = None, lry: float = None, **kwargs)
Warp JimVect object
Modifies the instance on which the method was called.
- Parameters:
jim_object – a Jim or JimVect object
t_srs – Target spatial reference system
bbox – bounding box (instead of ulx, uly, lrx, lry)
ulx – Upper left x value of bounding box
uly – Upper left y value of bounding box
lrx – Lower right x value of bounding box
lry – Lower right y value of bounding box
Example: warp vector to epsg:4326. Retain only those features within the defined bounding box:
v = pj.JimVect('/path/to/vector.sqlite')
v.geometry.warp(t_srs = 'epsg:4326',
                ulx = 9.8, uly = 45.8,
                lrx = 10.2, lry = 45.5)
Connected component operations
Connected component operation functions
Module for connected-component operations.
- ccops.alphaTree(atree, attr0cc, type: int)
Compute the alpha tree.
- Parameters:
atree – a Jim object
attr0cc – a Jim object
type – an integer
- Returns:
Jim object with the alpha tree
- ccops.alphaTreeDissim(dissimh, dissimv, alpha: int)
Create Jim holding the tree.
This function does not have the member function alternative.
- Parameters:
dissimh – Jim for horizontal edge dissimilarities
dissimv – Jim for vertical edge dissimilarities
alpha – integer for dissimilarity threshold value
- Returns:
the tree stored in an JimList
- ccops.alphaTreeNextLevel(atree, label_jim, alpha: int)
Compute the alpha tree next level.
- Parameters:
atree – a Jim object
label_jim – a Jim object
alpha – integer
- Returns:
Jim object representing the next level of alpha tree
- ccops.alphaTreePersistenceLut(atree)
Compute the alpha tree persistence lut.
- Parameters:
atree – a Jim object
- Returns:
Jim object representing the alpha tree persistence lut
- ccops.alphaTreeToCCs(atree, label_jim, lut: bool, rule: int)
Convert an alpha tree to connected components.
- Parameters:
atree – a Jim object
label_jim – a Jim object
lut – flag
rule – integer
- Returns:
Jim object representing alpha tree converted to CCs
- ccops.convertRgbToHsx(jim, x_type: str = 'V')
Convert RGB to HSX. Use rgb2hsv from skimage.color for other datatypes and rollaxis(0,3)
Returns the hue, saturation, and value, lightness, or intensity channels of an input RGB colour image. The hue component is identical for all 3 models. The luminance is equal to max(R,G,B) for HSV, (max-min)/2 for HSL and (R+G+B)/3 for HSI. See specific formulae for the saturation at <http://en.wikipedia.org/wiki/HSL_and_HSV>`__.
- Parameters:
jim – multi-band Jim with three bands representing red, green and blue channels
x_type – string with key (‘V’ (default) for Value, ‘L’ for Lightness, and ‘I’ for Intensity)
- Returns:
Jim with three bands containing the HSX channels
- ccops.dbscan(jim_dissim, eps: float, min_pts: int)
Compute dbscan.
- Parameters:
jim_dissim – a Jim object containing the dissimilarity matrix
eps – float
min_pts – integer
- Returns:
a Jim object
- ccops.dissim(jim_map, jim_mask, nc: int, type: int)
Compute the dissimilarity matrix.
- Parameters:
jim_map – a Jim object
jim_mask – a Jim object
nc – integer
type – integer
- Returns:
Jim object representing the dissimilarity matrix
- ccops.dissimToAlphaCCs(dissimh, dissimv, alpha: int)
Create Jim holding the labelled alpha-connected component.
- Parameters:
dissimh – Jim for horizontal edge dissimilarities
dissimv – Jim for vertical edge dissimilarities
alpha – integer for dissimilarity threshold value
- Returns:
Jim object
- ccops.distance2d4(jim, band: int = 0)
Compute the 2-dimensional 4-connected distance function of a Jim.
- Parameters:
jim – a Jim object
band – List of band indices to crop (index is 0 based)
- Returns:
a Jim object
- ccops.distance2dChamfer(jim, type: int, band: int = 0)
Compute the chamfer distance function of Jim.
Note that the type of Jim must be large enough to hold the largest distance otherwise overflow may occur and generate artefacts in the resulting distance function.
- Parameters:
jim – a Jim object
type – Integer for type of chamfer distance {1, 11, 34, 57, 5711}
band – List of band indices to crop (index is 0 based)
- Returns:
a Jim object
- ccops.distance2dEuclideanConstrained(marker, mask, band: int = 0)
Compute the Euclidean geodesic distance from the marker set.
Defined by the image marker and within the geodesic mask defined by the image mask. The algorithm is described in ([Soi91]).
Modifies the instance on which the method was called.
- Parameters:
marker – Image marker
mask – binary UCHAR image with geodesic mask pixels set to 1
band – List of band indices to crop (index is 0 based)
- ccops.distance2dEuclideanSquared(jim, band: int = 0)
Compute the squared Euclidean distance transform in 2-D.
jim must be a binary image. Multi-plane images will be processed plane by plane as 2-D images. The original algorithm was proposed by [ST94] and then optimised independently by [Hir96] and [MRH00]. Based on the Euclidean distance transform. Note that a temporary buffer of type UINT16 is used for sums along/lines and columns so that uncontrolled results will occur if an object shows more than 16 2 /2 foreground pixels along a given line or column.
- Parameters:
band – List of band indices to crop (index is 0 based)
- Returns:
a Jim object
- ccops.distanceGeodesic(mask, marker, graph: int, band: int = 0)
Compute geodesic distance function from marker within mask.
Using graph connectivity.
- Parameters:
mask – an image node for geodesic mask
marker – an image node for marker image
graph – integer for connectivity
band – List of band indices to crop (index is 0 based)
- Returns:
a Jim object
- ccops.distanceInfluenceZones2dEuclidean(jim, band: int = 0)
Output error-free influence zones of the labelled regions in Jim.
Jim must be a 2-D image, its last bit being reserved (e.g., for a UCHAR images, authorized label values range from 1 to 127). Algorithm based on the Euclidean distance transform.
- Parameters:
jim – a Jim object
band – List of band indices to crop (index is 0 based)
- Returns:
a Jim object
- ccops.flatZonesSeeded(jim1, jim2, jim3, ox: float, oy: float, oz: float)
Compute seeded flat zones.
- Parameters:
jim1 – a Jim object
jim2 – a Jim object
jim3 – a Jim object
ox – x coordinate of origin
oy – y coordinate of origin
oz – z coordinate of origin
- Returns:
a Jim object
- ccops.getRegionalMinima(jim, graph: int)
Compute regional minima of the input image.
The pixels belonging to a regional minimum are set to 1, all other pixels are set to 0.
- Parameters:
jim – a Jim object
graph – an integer holding for the graph connectivity (4 or 8 for 2-D images)
- Returns:
a new Jim object of type unsigned char containing regional minima of the input Jim object
- ccops.label(jim, ngb)
Label each connected component (non zero values) with a unique integer value using graph-connectivity.
The labels start from value 2.
- Parameters:
jim – a Jim object holding a binary image, data must be of unsigned integer type.
ngb –
Jim object for neighbourhood, e.g., create with:
pj.Jim(graph=4): horizontally and vertically connected in 2-D
pj.Jim(graph=6): horizontally and vertically connected in 3-D
pj.Jim(graph=8): horizontally, vertically, and diagonally connected in 2-D
pj.Jim(graph=26): horizontally, vertically, and diagonally connected in 3-D
- Returns:
labeled Jim object with unique integer values (starting from value 2) for each connected component.
Example:
Label horizontally and vertically connected pixels in 2-D image with unique labels:
jim = pj.Jim(ncol = 5, nrow = 5, otype = 'GDT_UInt16', uniform = [0,2])
labeled = pj.ccops.label(jim, pj.Jim(graph=4))
binary input image:
labeled output image with unique integer values for connected components (here represented by different gray scales):
Label horizontally and vertically connected pixels in 3-D image with unique labels:
jim = pj.Jim(ncol = 3, nrow = 3, nplane = 3, otype = 'GDT_Byte', uniform = [0,2])
labeled = pj.ccops.label(jim, pj.Jim(graph=6))
binary input 3-D image:
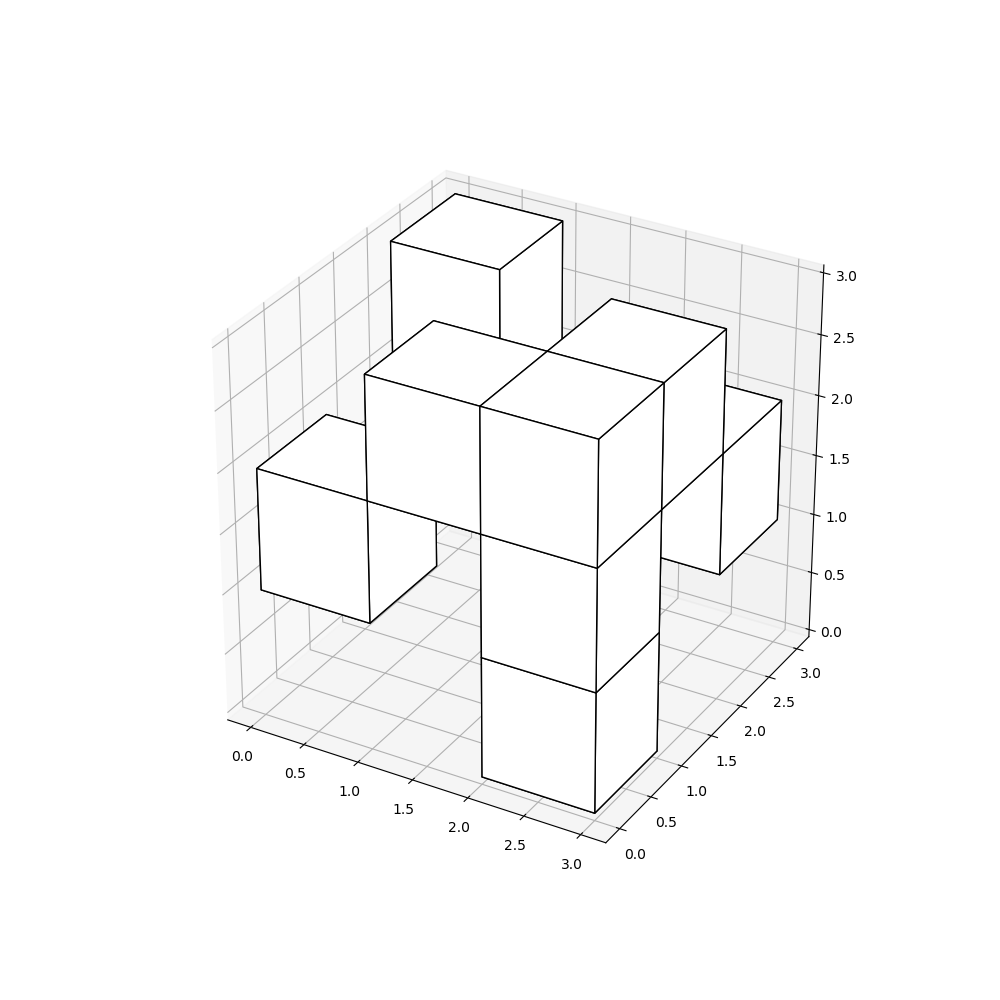
labeled output image with unique integer values for connected components (here represented by different gray scales):
- ccops.labelConstrainedCCs(jim, local_range: int, global_range: int, ngb)
Label each alpha-omega connected component.
Label with a unique label using graph-connectivity [Soi08]
- Parameters:
jim – a Jim or Jim list of grey level images having all the same definition domain and data type.
local_range – integer value indicating maximum absolute local difference between 2 adjacent pixels
global_range – integer value indicating maximum global difference (difference between the maximum and minimum values of each resulting connected component)
ngb – Jim object for neighbourhood, e.g., create with pj.Jim(graph=4)
- Returns:
labeled Jim object
- ccops.labelConstrainedCCsAttr(jim, graph: int, rg: int, rl: int)
Label image, in development.
- Parameters:
jim – a Jim object to label
graph – integer for graph connectivity
rg – integer
rl – integer for range parameter lambda l under the strongly connected assumption
- Returns:
labeled Jim object
- ccops.labelConstrainedCCsCi(jim, ngb, ox: float, oy: float, oz: float, rl: int)
Label image, in development.
- Parameters:
jim – a Jim object to label
ngb – a Jim object for neighbourhood
ox – x coordinate of origin of ngb Jim
oy – y coordinate of origin of ngb Jim
oz – z coordinate of origin of ngb Jim
rl – integer for range parameter lambda l under the strongly connected assumption
- Returns:
labeled Jim object
- ccops.labelConstrainedCCsDissim(jim, local_range: int, global_range: int, dissim_type: int = 0)
Label each alpha-omega connected components with a unique label.
Label using graph-connectivity and the dissimilarity measure countering the chaining effect as described in [Soi11]
- Parameters:
jim – a Jim or a Jim list of grey level images having all the same definition domain and data type.
local_range – integer value indicating maximum absolute local difference between 2 adjacent pixels along alpha-connected paths
global_range – integer value indicating maximum global difference (difference between the maximum and minimum values of each resulting connected component)
dissim_type – int value indicating type of dissimilarity measure. 0 (default) for absolute difference. 1 for dissimilarity measure countering the chaining effect as described in [Soi11]
- Returns:
labeled Jim object
- ccops.labelConstrainedCCsMi(jim, jim_mi, jim_se, ox: float, oy: float, oz: float, rg: int, rl: int)
Label image, in development.
- Parameters:
jim – a Jim object to label
jim_mi – a Jim object
jim_se – a Jim object
ox – x coordinate of origin of
oy – y coordinate of origin of
oz – z coordinate of origin of
rg – integer
rl – integer for range parameter lambda l under the strongly connected assumption
- Returns:
labeled Jim object
- ccops.labelConstrainedCCsVariance(jim, ox: float, oy: float, oz: float, rg: int, rl: int, varmax: float, ngb)
Label image.
- Parameters:
jim – a Jim object
ox – x coordinate of origin of ngb Jim
oy – y coordinate of origin of ngb Jim
oz – z coordinate of origin of ngb Jim
rg – integer for range parameter lambda g
rl – integer for range parameter lambda l
varmax – float for maximum variance of cc
ngb – Jim object for neighbourhood, e.g., create with pj.Jim(graph=4)
- Returns:
labeled Jim object
- ccops.labelErode(jim, graph: int = 4)
Label to contain the union of the erosions of the iso-intensity CCs.
- Parameters:
jim – a Jim object
graph – an integer holding for the graph connectivity (4 or 8 for 2-D images, default is 4)
- Returns:
labeled Jim object
- ccops.labelFlatZones(jim, ngb)
Label each image flat zone with a unique label using graph-connectivity.
- Parameters:
jim – a Jim object holding a grey level image
ngb – Jim object for neighbourhood, e.g., create with pj.Jim(graph=4)
- Returns:
labeled Jim object
- ccops.labelFlatZonesSeeded(jim, jim_ngb, jim_seeds, ox: float, oy: float, oz: float)
Label the flat regions using the ngb Jim and its origin.
- Parameters:
jim – a Jim object
jim_ngb – a Jim objects for neighbourhood
jim_seeds – A Jim object for seeds (must be of type UCHAR)
ox – x coordinate of origin of jim_ngb
oy – y coordinate of origin of jim_ngb
oz – z coordinate of origin of jim_ngb
- Returns:
labeled Jim object
- ccops.labelPixels(jim)
Label each non-zero pixel of im with a unique label.
Labels unless label overflows occurs.
- Parameters:
jim – a Jim object
- Returns:
labeled Jim object
- ccops.labelStronglyCCs(jim, local_range: int, ngb)
Label each strongly alpha-connected component.
Label with a unique label using graph-connectivity [Soi08]
- Parameters:
jim – a Jim or a Jim list of grey level images having all the same definition domain and data type.
local_range – integer value indicating maximum absolute local difference between 2 adjacent pixels
ngb – Jim object for neighbourhood, e.g., create with pj.Jim(graph=4)
- Returns:
labeled Jim object
- ccops.labelsOuterContour(jim_label, graph: int)
Get outer contour of labels.
- Parameters:
jim_label – a Jim object
graph – integer for connectivity
- Returns:
a Jim object containing the outher edge
- ccops.labelsOuterEdge(jim_label, graph: int)
Get outer edge of labels.
- Parameters:
jim_label – a Jim object containing labels
graph – integer for connectivity
- Returns:
a Jim object containing the outher edge
- ccops.labelsOuterEdgeLut(jim_label, jim_edge_label)
Get outer edge lut of labels.
- Parameters:
jim_label – a Jim object containing labels
jim_edge_label – a Jim object containing the labels outer edge
- Returns:
a Jim object containing the outher edge lut
- ccops.labelsSet(label_jim, ival_jim, indic: int)
Set labels to regions.
- Parameters:
label_jim – Jim object with labels
ival_jim – a Jim object
indic – an integer
- Returns:
a Jim object with set region labels
- ccops.labelsSetArea(jim)
Set area to regions based on Tessel surface.
- Parameters:
jim – Jim object with labels (data must be of unsigned integer type)
- Returns:
a Jim object with area set to region labels
Example:
Label horizontally and vertically connected pixels in 2-D image with unique labels and set area:
jim = pj.Jim(ncol = 5, nrow = 5, otype = 'GDT_UInt16', uniform = [0,2])
labeled = pj.ccops.label(jim, pj.Jim(graph=4))
area = pj.ccops.labelsSetArea(labeled)
binary input image:
labeled output image with unique integer values for connected components (here represented by different gray scales):
output image with area for connected components:
- ccops.labelsSetGraph(label_jim, ival_jim, indic: int, graph: int)
Set labels to regions.
- Parameters:
label_jim – Jim object with labels
ival_jim – a Jim object
indic – an integer
graph – an integer holding for the graph connectivity
- Returns:
a Jim object with set region labels
- ccops.morphoFillHoles(jim_object, graph: int, border_flag: int = 1)
Remove the not border-connected regional minima of the image.
Uses graph connectivity (originally proposed for removing pits in digital elevation models. See [SA90] and [SG94] for a fast implementation)
- Parameters:
jim_object – input Jim object
border_flag
graph – an integer holding for the graph connectivity (4 or 8 for 2-D images)
- Returns:
a new Jim object with the connected component of the input object removed
- ccops.morphoGeodesicReconstructionByDilation(jim_object_mark, jim_object_mask, graph: int, border_flag: int = 1)
Compute the morphological reconstruction by dilation of mask image.
Mask image is from mark image using graph connectivity.
- Parameters:
jim_object_mark – a Jim object for marker image
jim_object_mask – a Jim object for mask image
graph – an integer holding for the graph connectivity (4 or 8 for 2-D images)
border_flag – integer (border values are set to PIX MIN in BOTH images if flag equals 0, otherwise the image are internally processed by adding a border which is then removed at the end of the processing). Default value is 1.
- Returns:
jim_object_mark containing the result of the morphological reconstruction by dilation
- ccops.morphoGeodesicReconstructionByErosion(jim_object_mark, jim_object_mask, graph: int, border_flag: int = 1)
Compute the morphological reconstruction by erosion of mask image.
Mask image is from mark image using graph connectivity.
- Parameters:
jim_object_mark – a Jim object for marker image
jim_object_mask – a Jim object for mask image
graph – an integer holding for the graph connectivity (4 or 8 for 2-D images)
border_flag – integer (border values are set to PIX MIN in BOTH images if flag equals 0, otherwise the image are internally processed by adding a border which is then removed at the end of the processing). Default value is 1.
- Returns:
jim_object_mark containing the result of the morphological reconstruction by erosion
- ccops.morphoRemoveBorder(jim_object, graph: int)
Remove the border-connected components of an image.
Uses graph connectivity.
- Parameters:
jim_object – input Jim object
graph – an integer holding for the graph connectivity (4 or 8 for 2-D images)
- Returns:
a new Jim object with the connected component of the input object removed
- ccops.partitionSimilarity(jim1, jim2, graph: int)
Create a list of 4 1-D images.
They contain the following information: correspondence table between the labels of im1 and im2, similarity measure between these labels, correspondence table between the labels of im2 and im1, similarity measure between these labels. Create Jim holding the tree.
- Parameters:
jim1 – first image
jim2 – second image
graph – an integer for connectivity
- Returns:
a list of images
- ccops.propagate(label_jim, dst_jim, imap_jim, nc: int, graph: int)
Perform propagation.
- Parameters:
label_jim – a Jim object with labels
dst_jim – a Jim object
imap_jim – a Jim object
nc – an integer
graph – an integer for connectivity
- Returns:
propagated Jim object
- ccops.relabel(jim_label1, jim_label2, jim_area)
Perform propagation.
- Parameters:
jim_label1 – a Jim object
jim_label2 – a Jim object
jim_area – a Jim object
- Returns:
relabeled Jim object
- ccops.seededRegionGrowing(jim, seeds, ngb)
Calculate the seeded region growing.
Seeded region growing [AB94] including adaptations presented in [MJ97].
A seeded region algorithm whereby labelled seeds (seeds) are grown in a multi-channel image using graph-connectivity. The growth is driven by the spectral distances (L2 norm) are calculated between pixels along the external boundary of the already grown regions and the corresponding pixels along the internal boundary of the seeds. Both jim and seeds are modified by this function. The image of seeds is modified by expanding the corresponding initial values of the seeds.
- Parameters:
jim – a Jim or Jim list of grey level images having all the same definition domain and data type.
seeds – a Jim image for labelled seeds (UINT32 type)
ngb – Jim object for neighbourhood, e.g., create with pj.Jim(graph=4)
- Returns:
labeled Jim object
- ccops.segmentBinaryPatterns(jim_object, graph: int = 8, size: float = 1.0, transition: int = 1, internal: int = 1)
Morphological segmentation of binary patterns (Morphological Spatial Pattern Analysis MSPA).
Described in [SV09], see also [SV22]
- Parameters:
jim_object – input Jim object with pixels of type unsigned char and with foreground pixels set to 2, background pixels set to 1, and no data pixels set to 0.
size – a float value >=1.0 indicating the width of the edges;
graph – an integer (4 or 8) holding for the graph connectivity (default 8)
transition – a Boolean integer value (0 or 1) indicating how transitions should be processed (default 1)
internal – a Boolean integer value (0 or 1) indicating how embedded components should be processed with 0 for no special treatment or 1 for assigning special values to pixels belonging to embedded components like core components fully surrounded by a larger core component (default 1)
- Returns:
a new Jim object of type unsigned char holding the morphological segmentation of the input binary image.
The following table indicates the correspondence between the byte values of the output image and their corresponding class:
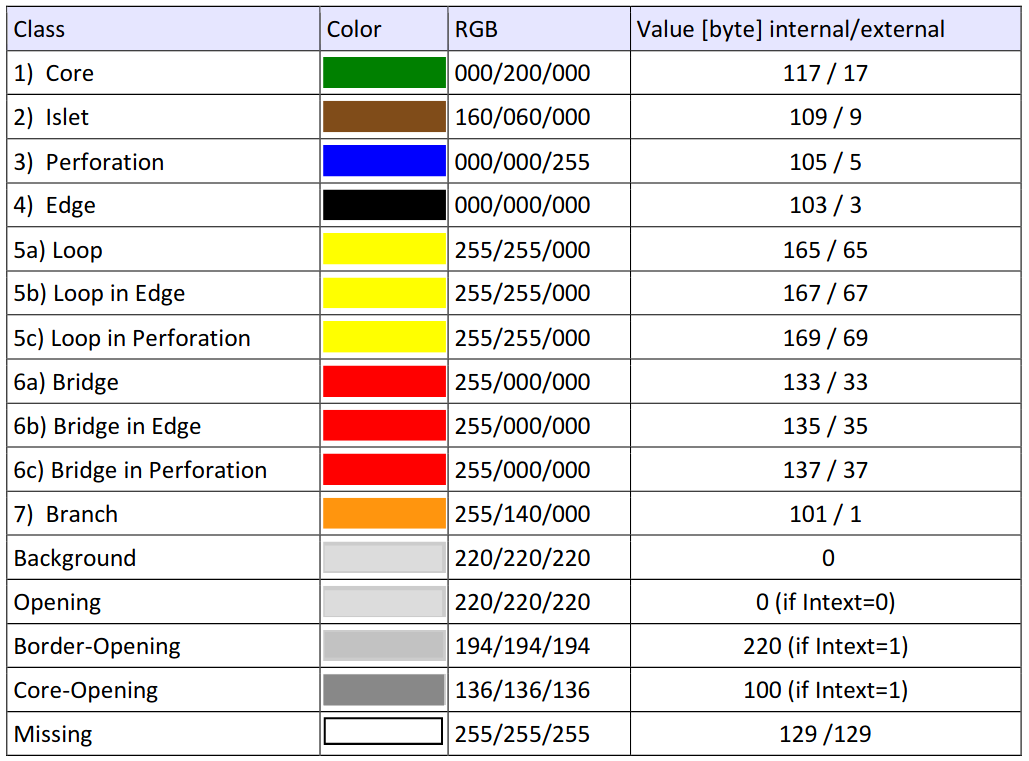
Note
For a visual rendering, a MSPA color table needs to be added to the image. This can be done upon writing the image on disk. There are 2 color tables depending on whether the transition parameter was set to 0 (OFF) or 1 (ON): MSPA_color-table_transitionOFF.txt or MSPA_color-table_transitionON.txt. See example below (the path to the color table needs to be adpated according to the local installation).
Example:
i0=pyjeo.Jim('/vsicurl/https://github.com/ec-jrc/GWB/raw/main/input/example.tif')
i1=pyjeo.ccops.segmentBinaryPatterns(i0, 8, 1, 1, 1)
i1.io.write('example_MSPA_8111.tif',  ct = './tests/data/MSPA_color-table_transitionON.txt')
- ccops.segmentImageMultiband(jimlist, local_range: int, region_size: int, contrast: int = 0, version: int = 0, graph: int = 4, filename_prefix: str = '')
Do multiband image segmentation.
Based on the method described in [BS07]
The contrast threshold value is used for merging the regions with similar contrast as follows: < 0 (do not perform region merge), 0 (determine best contrast value automatically), and > 0 (use this value as threshold value). Authorised version values are: 0 (compare to whole region), 1 (compare to original seeds), and 2 (compare to pixel neighbours). If the optional string filename_prefix is given, data files to use with gnuplot are stored in filename_prefix_xxx.dat, otherwise data files are not generated (default).
- Parameters:
jimlist – a Jim list of grey level images having all the same definition domain and data type.
local_range – integer value indicating maximum absolute local difference between 2 adjacent pixels
region_size – integer value for minimum size of iso-intensity region in output image (must be >= 2 pixels)
contrast – (default is 0)
version – (default is 0)
graph – an integer holding for the graph connectivity (4 or 8 for 2-D images, default is 4)
filename_prefix – Prefix for filenames
- Returns:
labeled Jim object
- ccops.vertexConnectedness(jim_object, alpha: int, graph: int = 8, deg: int = None)
Label Jim based on vertex connectedness.
- Parameters:
jim_object – input Jim object
alpha – value
graph – an integer holding for the graph connectivity (4 or 8 for 2-D images)
deg – integer
- Returns:
vertex connectedness labeled Jim
- ccops.vertexDegreeAlpha(jim_object, alpha: int, graph: int = 8)
Label Jim based on vertex degree alpha.
- Parameters:
jim_object – input Jim object
alpha – value
graph – an integer holding for the graph connectivity (4 or 8 for 2-D images)
- Returns:
vertex degree alpha labeled Jim
- ccops.vertexSeparation(jim_object, graph: int = 8, type: int = None)
Label Jim based on vertex separation.
- Parameters:
jim_object – input Jim object
graph – an integer holding for the graph connectivity (4 or 8 for 2-D images)
type – integer
- Returns:
vertex separated labeled Jim
- ccops.watershed(jim_object, graph: int = 8)
Watershed segmentation based on immersion simulation.
Described in [SV90], see also [VS91]
- Parameters:
jim_object – input Jim object
graph – an integer holding for the graph connectivity (4 or 8 for 2-D images)
- Returns:
a new Jim object with the connected component of the input object removed
Connected component operation methods on Jim
- class ccops._CCOps
Define all CCOps methods.
- alphaTree(attr0cc, type: int)
Compute the alpha tree.
Modifies the instance on which the method was called.
- Parameters:
attr0cc – a Jim object
type – an integer
- alphaTreeNextLevel(label_jim, alpha: int)
Convert an alpha tree to connected components.
Modifies the instance on which the method was called.
- Parameters:
label_jim – a Jim object
alpha – integer
- alphaTreePersistenceLut()
Compute the alpha tree persistence lut.
Modifies the instance on which the method was called.
- alphaTreeToCCs(label_jim, lut: bool, rule: int)
Convert an alpha tree to connected components.
Modifies the instance on which the method was called.
- Parameters:
label_jim – a Jim object
lut – flag
rule – integer
- convertRgbToHsx(x_type: str = 'V')
Convert RGB to HSX (only for byte images) Use rgb2hsv from skimage.color for other datatypes and rollaxis(0,3)
Returns the hue, saturation, and value, lightness, or intensity channels of an input RGB colour image. The hue component is identical for all 3 models. The luminance is equal to max(R,G,B) for HSV, (max-min)/2 for HSL and (R+G+B)/3 for HSI. See specific formulae for the saturation at http://en.wikipedia.org/wiki/HSL_and_HSV.
Modifies the instance on which the method was called.
- Parameters:
x_type – string with key (‘V’ (default) for Value, ‘L’ for Lightness, and ‘I’ for Intensity)
- dbscan(eps: float, min_pts: int)
Compute dbscan.
This method should be called on an object which contains a dissimilarity matrix.
Modifies the instance on which the method was called.
- Parameters:
eps – float
min_pts – integer
- dissim(jim_mask, nc: int, type: int)
Compute the dissimilarity matrix.
Modifies the instance on which the method was called.
- Parameters:
jim_mask – a Jim object
nc – integer
type – integer
- distance2d4(band: int = 0)
Compute the 2-dimensional 4-connected distance function of a Jim.
Modifies the instance on which the method was called.
- Parameters:
band – List of band indices to crop (index is 0 based)
- distance2dChamfer(type: int, band: int = 0)
Compute the chamfer distance function of Jim.
Note that the type of Jim must be large enough to hold the largest distance otherwise overflow may occur and generate artefacts in the resulting distance function.
Modifies the instance on which the method was called.
- Parameters:
type – Integer for type of chamfer distance {1, 11, 34, 57, 5711}
band – List of band indices to crop (index is 0 based)
- distance2dEuclideanConstrained(mask, band: int = 0)
Compute the Euclidean geodesic distance from the marker set.
Defined by the image marker and within the geodesic mask defined by the image mask. The algorithm is described in ([Soi91]).
Modifies the instance on which the method was called.
- Parameters:
mask – binary UCHAR image with geodesic mask pixels set to 1
band – List of band indices to crop (index is 0 based)
- distance2dEuclideanSquared(band: int = 0)
Compute the squared Euclidean distance transform in 2-D.
The instance must be a binary image. Multi-plane images will be processed plane by plane as 2-D images. The original algorithm was proposed by [ST94] and then optimised independently by [Hir96] and [MRH00]. Based on the Euclidean distance transform. Note that a temporary buffer of type UINT16 is used for sums along/lines and columns so that uncontrolled results will occur if an object shows more than 2^16 /2 foreground pixels along a given line or column.
Modifies the instance on which the method was called.
- Parameters:
band – List of band indices to crop (index is 0 based)
Example:
Create a binary image that is 1 at the center and border and 0 elsewhere:
jim = pj.Jim(nrow=30, ncol=30, otype='Byte')

jim[15-1:15+1,15-1:15+1] = 1
jim[15-1:15+1,15-1:15+1] = 1
jim[0,:] = 1
jim[-1,:] = 1
jim[:,0] = 1
jim[:,-1] = 1
binary input image:
To Euclidean distance is calculated from the background pixels (value 0) to the foreground pixels (value 1). If we want to calculate the distance from the foreground to the background (e.g., distance from binary cloud mask to nearest clear pixel), the image must be negated first:
jim = jim != 1
jim.ccops.distance2dEuclideanSquared()
Squared Euclidean distance image:
The cloud mask can then be extended by thresholding the distance image:
jim = jim < 4
- distanceGeodesic(marker, graph: int, band: int = 0)
Compute geodesic distance function from marker within mask.
Using graph connectivity.
Modifies the instance on which the method was called.
- Parameters:
marker – an image node for marker image
graph – integer for connectivity
band – List of band indices to crop (index is 0 based)
- distanceInfluenceZones2dEuclidean(band: int = 0)
Output error-free influence zones of the labelled regions in Jim.
Jim must be a 2-D image, its last bit being reserved (e.g., for a UCHAR images, authorized label values range from 1 to 127).
Modifies the instance on which the method was called.
- Parameters:
band – List of band indices to crop (index is 0 based)
- flatZonesSeeded(jim2, jim3, ox: float, oy: float, oz: float)
Compute seeded flat zones.
Modifies the instance on which the method was called.
- Parameters:
jim2 – a Jim object
jim3 – a Jim object
ox – x coordinate of origin
oy – y coordinate of origin
oz – z coordinate of origin
- label(ngb)
Label each connected component (non zero values) with a unique integer value using graph-connectivity.
The labels start from value 2. Modifies the instance on which the method was called.
- Parameters:
ngb –
Jim object for neighbourhood, e.g., create with:
pj.Jim(graph=4): horizontally and vertically connected in 2-D
pj.Jim(graph=6): horizontally and vertically connected in 3-D
pj.Jim(graph=8): horizontally, vertically, and diagonally connected in 2-D
pj.Jim(graph=26): horizontally, vertically, and diagonally connected in 3-D
Example:
Label horizontally and vertically connected pixels in 2-D image with unique labels:
jim = pj.Jim(ncol = 5, nrow = 5, otype = 'GDT_UInt16', uniform = [0,2])
jim.ccops.label(pj.Jim(graph=4))
binary input image:
labeled output image with unique integer values for connected components (here represented by different gray scales):
Label horizontally and vertically connected pixels in 3-D image with unique labels:
jim = pj.Jim(ncol = 3, nrow = 3, nplane = 3, otype = 'GDT_Byte', uniform = [0,2])
jim.ccops.label(pj.Jim(graph=6))
binary input 3-D image:
labeled output image with unique integer values for connected components (here represented by different gray scales):
- labelConstrainedCCs(local_range: int, global_range: int, ngb)
Label each alpha-omega connected component.
Label with a unique label using graph-connectivity [Soi08]
- Parameters:
local_range – integer value indicating maximum absolute local difference between 2 adjacent pixels
global_range – integer value indicating maximum global difference (difference between the maximum and minimum values of each resulting connected component)
ngb – Jim object for neighbourhood, e.g., create with pj.Jim(graph=4)
- labelConstrainedCCsAttr(graph: int, rg: int, rl: int)
Label image, in development.
- Parameters:
graph – integer for graph connectivity
rg – integer
rl – integer for range parameter lambda l under the strongly connected assumption
- Returns:
labeled Jim object
- labelConstrainedCCsCi(ngb, ox: float, oy: float, oz: float, rl: int)
Label image, in development.
Modifies the instance on which the method was called.
- Parameters:
ngb – a Jim object for neighbourhood
ox – x coordinate of origin of ngb Jim
oy – y coordinate of origin of ngb Jim
oz – z coordinate of origin of ngb Jim
rl – integer for range parameter lambda l under the strongly connected assumption
- labelConstrainedCCsMi(jim_mi, jim_se, ox: float, oy: float, oz: float, rg: int, rl: int)
Label image, in development.
Modifies the instance on which the method was called.
- Parameters:
jim_mi – a Jim object
jim_se – a Jim object
ox – x coordinate of origin of ngb Jim
oy – y coordinate of origin of ngb Jim
oz – z coordinate of origin of ngb Jim
rg – integer
rl – integer for range parameter lambda l under the strongly connected assumption
- labelConstrainedCCsVariance(ox: float, oy: float, oz: float, rg: int, rl: int, varmax: float, ngb)
Label image.
Modifies the instance on which the method was called.
- Parameters:
ox – x coordinate of origin of ngb Jim
oy – y coordinate of origin of ngb Jim
oz – z coordinate of origin of ngb Jim
rg – integer for range parameter lambda g
rl – integer for range parameter lambda l
varmax – float for maximum variance of cc
ngb – Jim object for neighbourhood, e.g., create with pj.Jim(graph=4)
- labelErode(graph: int = 4)
Label to contain the union of the erosions of the iso-intensity CCs.
Modifies the instance on which the method was called.
- Parameters:
graph – an integer holding for the graph connectivity (4 or 8 for 2-D images, default is 4)
- labelFlatZonesSeeded(jim_ngb, jim_seeds, ox: float, oy: float, oz: float)
Label the flat regions using the ngb Jim and its origin.
- Parameters:
jim_ngb – a Jim objects for neighbourhood
jim_seeds – A Jim object for seeds (must be of type UCHAR)
ox – x coordinate of origin of jim_ngb
oy – y coordinate of origin of jim_ngb
oz – z coordinate of origin of jim_ngb
- labelPixels()
Label each non-zero pixel of im with a unique label.
Labels unless label overflows occurs.
Modifies the instance on which the method was called.
- labelsOuterContour(graph: int)
Compute the outer contour of labels.
This method should be called on a Jim object which contains labels.
Modifies the instance on which the method was called.
- Parameters:
graph – integer for connectivity
- labelsOuterEdge(graph: int)
Compute the outer edge of labels.
This method should be called on a Jim object which contains labels.
Modifies the instance on which the method was called.
- Parameters:
graph – integer for connectivity
- labelsOuterEdgeLut(jim_edge_label)
Compute the outer edge lut of labels.
This method should be called on a Jim object which contains labels.
Modifies the instance on which the method was called.
- Parameters:
jim_edge_label – a Jim object containing the labels outer edge
- labelsSet(ival_jim, indic: int)
Set labels to regions.
Modifies the instance on which the method was called.
- Parameters:
ival_jim – a Jim object
indic – an integer
- Returns:
a Jim object with set region labels
- labelsSetArea()
Set area to regions based on Tessel surface.
Example:
Label horizontally and vertically connected pixels in 2-D image with unique labels and set area:
jim = pj.Jim(ncol = 5, nrow = 5, otype = 'GDT_UInt16', uniform = [0,2])
jim.ccops.label(pj.Jim(graph=4))
jim.ccops.labelsSetArea()
binary input image:
labeled output image with unique integer values for connected components (here represented by different gray scales):
output image with area for connected components:
- labelsSetGraph(ival_jim, indic: int, graph: int)
Set labels to regions.
Modifies the instance on which the method was called.
- Parameters:
ival_jim – a Jim object
indic – an integer
graph – an integer holding for the graph connectivity
- Returns:
a Jim object with set region labels
- morphoFillHoles(graph: int, border_flag: int = 1)
Remove the image-border-connected regional minima.
Uses graph connectivity.
Modifies the instance on which the method was called.
- Parameters:
border_flag
graph – an integer holding for the graph connectivity (4 or 8 for 2-D images)
- morphoGeodesicReconstructionByDilation(jim_object_mask, graph: int, flag: int = 1)
Compute the morphological reconstruction by dilation.
Dilation of the current object is from mark image using graph connectivity.
Modifies the instance on which the method was called.
- Parameters:
jim_object_mask – a Jim object for mask image
graph – an integer holding for the graph connectivity (4 or 8 for 2-D images)
flag – integer (border values are set to PIX MIN in BOTH images if flag equals 0, otherwise the image are internally processed by adding a border which is then removed at the end of the processing). Default value is 1.
- morphoGeodesicReconstructionByErosion(jim_object_mask, graph: int, flag: int = 1)
Compute the morphological reconstruction by erosion.
Erosion of the current object is from mark image using graph connectivity.
Modifies the instance on which the method was called.
- Parameters:
jim_object_mask – a Jim object for mask image
graph – an integer holding for the graph connectivity (4 or 8 for 2-D images)
flag – integer (border values are set to PIX MIN in BOTH images if flag equals 0, otherwise the image are internally processed by adding a border which is then removed at the end of the processing). Default value is 1.
- morphoRemoveBorder(graph: int)
Remove the border-connected components using graph connectivity.
Modifies the instance on which the method was called.
- Parameters:
graph – an integer holding for the graph connectivity (4 or 8 for 2-D images)
- propagate(dst_jim, imap_jim, nc: int, graph: int)
Perform propagation.
- Parameters:
dst_jim – a Jim object
imap_jim – a Jim object
nc – an integer
graph – an integer for connectivity
- relabel(jim_label2, jim_area)
Perform propagation.
- Parameters:
jim_label2 – a Jim object
jim_area – a Jim object
- vertexConnectedness(alpha: float, graph: int = 8, deg: int = None)
Label Jim based on vertex connectedness.
- Parameters:
alpha – value
graph – an integer holding for the graph connectivity (4 or 8 for 2-D images)
deg – integer
- Returns:
vertex connectedness labeled Jim
- vertexDegreeAlpha(alpha: float, graph: int = 8)
Label Jim based on vertex degree alpha.
- Parameters:
alpha – value
graph – an integer holding for the graph connectivity (4 or 8 for 2-D images)
- Returns:
vertex degree alpha labeled Jim
- vertexSeparation(graph: int = 8, type: int = None)
Label Jim based on vertex degree alpha.
- Parameters:
graph – an integer holding for the graph connectivity (4 or 8 for 2-D images)
type – integer
- Returns:
vertex separated labeled Jim
Classification
Classification from sklearn (ndimage)
The classification operations from sklearn can be applied to a Jim object by using its numpy representation (Jim.np())
For examples, please refer to the tutorial on classification
Classification functions
Module for operations connected to classification.
- classify.reclass(jim_object, classes: list, reclasses: list, otype=None)
Reclassify a Jim object, replacing all pixels in the set classes.
Replace all pixels in the set class to the corresponding values in reclasses
- Parameters:
jim_object – a Jim object
classes – list of source values that need to be replaced
reclasses – list of target values to which the pixels should be replaced
otype – Data type
- Returns:
Jim object with replaced values
see
reclass()for an example
- classify.sml(jim_object, reflist=None, classes: list = None, model: str = None, **kwargs)
Perform supervised classification of a Jim object using SML.
For training, one or more reference raster datasets with categorical values is expected as a JimList. The reference raster dataset is typically at a lower spatial resolution than the input raster dataset to be classified. Unlike the Jim.classify(), the training is performed not prior to the classification, but in the same process as the classification.
- Parameters:
jim_object – a multi-plane Jim object
reflist – JimList of reference raster datasets containing with reference classes
classes – List of classes to extract from the reference (leave empty to extract all classes in reference)
model – Model filename for trained classifier
- Returns:
multi-band Jim object, where each band represents the probability for each class
see
sml()for an example how to use this function
Classification methods on Jim
- class classify._Classify
Define all classification methods for Jims.
- reclass(classes: list, reclasses: list, otype=None)
Reclassify a Jim object.
Replace all pixels in the set classes to the corresponding values in reclasses.
- Parameters:
classes – list of source values that need to be replaced
reclasses – list of target values to which the pixels should be replaced
otype – Data type
Reclass a Jim object, replacing all values in [0,1,2] to [250,251,252]:
jim.classify.reclass(classes=[0,1,2],reclasses[250,251,252])
- sml(reflist=None, classes: list = None, model: str = None, **kwargs)
Perform supervised classification of a Jim object using SML.
Symbolic machine learning (SML) is a classification method that is based on symbolic learning techniques. It is designed to work in complex and information-abundant environments, where relationships among different data layers are assessed in model-free and computationally-effective modalities (reference)
For training, one or more reference raster datasets with categorical values is expected as a JimList. The reference raster dataset is typically at a lower spatial resolution than the input raster dataset to be classified. Unlike the Jim.classify(), the training is performed not prior to the classification, but in the same process as the classification.
Modifies the instance on which the method was called.
- Parameters:
reflist – JimList of reference raster datasets containing with reference classes
model – Model filename for trained classifier
reflist – JimList of reference raster datasets containing with reference classes
classes – list of classes to extract from the reference. (leave empty to extract all classes in reference)
jim_sml = pj.classify.sml(reference, classes=[0,1,2], jim)
The result is a multi-band
Jimobject where the number of bands equals the number of classes and each band represents the probability for the respective class. To create a discrete classification result, based on the maximum probability for each class:jim_sml.geometry.band2plane() jim_sml.np()[0] = np.argmax(jim_sml.np(), axis=0) jim_sml.geometry.cropPlane(0)
The result contains the indices in the range(0, number of classes). Use
reclass()to convert the indices to the actual class numbers.
- trainSML(reference, output: str = None, **kwargs)
Train a supervised symbolic machine learning (SML) classifier.
Train it based on a reference
JimListobject- Parameters:
reference – (list of) Jim objects containing reference raster dataset(s)
output – output filepath where trained model will be written (leave empty to return as a string)
kwargs – See below
keyword arguments:
band
(list of) band index (indices) (starting from 0)
classes
list of classes to extract from reference. Leave empty to extract two classes only: 1 against rest
srcnodata
No data value in source (do not consider for training)
Example: train a Jim object (jim) with four Sentinel-2 bands using a single reference image (e.g., corine land cover):
corine = pj.Jim('/path/to/corine.tif')
jim.classify.trainSML(
    corine, output='/path/to/model.txt', classes=[12, 40])
Use
sml()to perform the classificationTypically, the SML algorithm performs a discretization, in order to reduce the dynamic range of the input and limit the number of unique sequences. For instance, to reduce the dynamic range of the input to NBIT bits:
NBIT=3
jim += 2 ** (8 - NBIT) - jim.stats.getStats(['min'])['min']
jim *= (2 ** 8 - 1) / jim.stats.getStats(['max'])['max']
jim >>= 8-NBIT
Digital elevation
Digital elevation functions from RichDEM
Digital elevation functions from third party packages that implement a data model that is compatible to Numpy arrays can easily be integrated with pyjeo. For instance, the High-Performance Terrain Analysis package RichDem has a data model similar to pyjeo, that can use Numpy arrays without a memory copy [Bar16]. The geotransform and projection information must be copied from the Jim to the RichDEM object:
dem_richdem.geotransform = jim.properties.getGeoTransform()
dem_richdem.projection = jim.properties.getProjection()
For example, to calculate the slope in degrees, based on [Hor81] the functions from the terrain attributes can be used. A nice feature is that a no data value (-9999) can be discarded during the calculation. Here all values of the DEM smaller than or equal to 0 are discarded:
import richdem as rd

jim = pj.Jim('/path/to/dem.tif')
jim.pixops.convert('GDT_Float32')
jim[jim <= 0] = -9999
dem_richdem  = rd.rdarray(jim.np(), no_data=-9999)
dem_richdem.geotransform = jim.properties.getGeoTransform()
dem_richdem.projection = jim.properties.getProjection()
slope = rd.TerrainAttribute(dem_richdem, attrib='slope_degrees')
jim.np()[:] = slope
jim.properties.setNoDataVals(-9999)
Native digital elevation methods on Jim
Module for operations connected to digital elevation models.
- demops.catchmentBasinConfluence(jim_object, d8)
Compute the catchment basin confluence.
- Parameters:
jim_object – an image node holding labelled outlet pixels with value 1 and river pixels with value 2
d8 – an image node holding d8 flow directions
- Returns:
a Jim object
- demops.catchmentBasinOutlet(jim_object, d8)
Compute the catchment basin outlet.
- Parameters:
jim_object – an image node holding labelled outlets
d8 – an image node holding d8 flow directions
- Returns:
a Jim object
- demops.contribDrainArea(jim_object, graph: int)
Output the contributing drainage areas of a DEM.
Outputs the contributing drainage areas of a DEM given its graph-connected drainage directions coded as follows: NW=5, N=3, NE=7, W=1, E=2, SW=6, S=4, SE=8.
- Parameters:
jim_object – an image node with D8 drainage directions (UCHAR)
graph – integer for number of possible flow directions (either 4 or 8)
- Returns:
a Jim object
- demops.contribDrainAreaInf(jim_object)
Output the contributing drainage areas of a DEM.
Outputs the contributing drainage areas of a DEM given its dinf drainage directions.
- Parameters:
jim_object – a Jim object with Dinf drainage directions (t FLOAT, -1.0 for undefined direction)
- Returns:
a Jim object
- demops.contribDrainAreaStrat(cda, threshold, dir)
Extract river networks.
Do it by flagging the downstreams of all points whose contributing drainage areas exceed those given by the threshold image. The dowstreams are detected by following the drainage directions stored in the image dir.
- Parameters:
cda – an image node (INT32) for contributing drainage area
threshold – an image node (USHORT) for cda threshold levels
dir – an image node (UCHAR) for flow directions
- Returns:
- demops.floodDir(jim_object, graph: int)
Compute the local flow directions.
Compute them as the inverse of the flood wave direction occurring during an immersion simulation (i.e., flooding starting from the lowest elevations). The codes for each direction are as follows: NW=5, N=3, NE=7, W=1, E=2, SW=6, S=4, SE=8. When a pixel has no lower neighbour, it is set to 0.
- Parameters:
jim_object – a Jim object
graph – integer for number of nearest neighbours to consider (either 4 or 8)
- Returns:
a Jim object
- demops.flow(jim_object, graph: int)
Compute the contributing drainage areas using D8 drainage directions.
- Parameters:
jim_object – a Jim object
graph – integer for number of nearest neighbours to consider
- Returns:
a Jim object
- demops.flowDirectionD8(jim_object)
Compute the D8 steepest slope direction of each pixel.
The codes for each direction are as follows: NW=5, N=3, NE=7, W=1, E=2, SW=6, S=4, SE=8. When a pixel has no lower neighbour, it is set to 0.
- Parameters:
jim_object – a Jim object
- Returns:
a Jim object
- demops.flowDirectionDInf(jim_object)
Compute the dinf steepest slope direction of each pixel.
computes the dinf steepest slope direction of each pixel according to (Tarboton, 1997). Slope directions are measured counter-clockwise from east, i.e., range equals (0,2pi)values are in the range (0,2pi), while pixels having no dowslope (plateaus and pits) are set to -1.
- Parameters:
jim_object – a Jim object
- Returns:
a Jim object
- demops.flowDirectionFlat(jim_object, dem_jim, graph: int)
See publication [Soi02]).
Flat regions (i.e., no flow direction) must be of type USHORT (with flat regions set to 65533) or INT32 (with flat regions set to INT32 MAX-2).
- Parameters:
jim_object – an image node for flat regions (USHORT or INT32)
dem_jim – an image node for corresponding DEM (USHORT)
graph – integer for number of nearest neighbours to consider
- Returns:
a Jim object
- demops.flowDirectionFlatGeodesic(jim_object, dem_jim, graph: int)
Inverse geodesic distance Away From Ascending Border.
- Parameters:
jim_object – a Jim object
dem_jim – a Jim object containing DEM
graph – integer for number of nearest neighbours to consider
- Returns:
a Jim object
- demops.flowNew(jim_object, drain_image, graph: int = 8)
Compute the contributing drainage area of each pixel.
Computes the contributing drainage area of each pixel of im given the graph-connected drainage directions stored in imdir.
- Parameters:
jim_object – a Jim object
drain_image – the d8 drainage directions for each pixel of im
graph – integer for connectivity (must be 8)
- Returns:
a Jim object
- demops.hillShade(jim_object, sza_image, saa_image)
Compute the hillshade of the digital elevation model baseed on Sun angles.
- Parameters:
jim_object – a Jim object containing the digital elevation model
sza_image – a Jim object containing the Sun zenith angle per pixel data type must be identical to saa_image
saa_image – a Jim object containing the Sun azimuth angle per pixel data type must be identical to sza_image
- Returns:
a binary Jim object with the hillshade (of type GDT_Byte)
- demops.pitRemovalCarve(labeled_jim, grey_jim, graph: int, maxfl: int)
Use for carving.
Algorithm description in [SVC03] and [Soi04a]
- Parameters:
labeled_jim – an image node with labelled relevant minima
grey_jim – an image node with grey tone image
graph – an integer for connectivity
maxfl – an integer for highest flooding level
- Returns:
a Jim object
- demops.pitRemovalOptimal(labeled_jim, grey_jim, graph: int, maxfl: int, flag: bool)
Optimal removal of spurious pits in grid digital elevation models.
Note that irrelevant minima must have all an intensity greater than that of the lowest minimum! The actual carved image is stored in imr. [Soi04b]
- Parameters:
labeled_jim – an image node with labelled relevant minima
grey_jim – an image node with grey tone image
graph – an integer for connectivity
maxfl – an integer for highest flooding level
flag – 0 (default) for energy based, area based otherwise
- Returns:
a Jim object
- demops.slope(jim_object, scale: float = 1.0, zscale: float = 1.0, percent: bool = False)
Compute the slope of a Jim object.
- Parameters:
jim_object – Jim
scale – horizontal scale
zscale – vertical scale
percent – if True, return value in percents, degrees otherwise
- Returns:
a Jim object representing the slope
- demops.slopeD8(jim_object)
Compute the steepest slope within a 3x3 neighbourhood for each pixel.
It corresponds to the slope along the D8 direction.
- Parameters:
jim_object – a Jim object
- Returns:
a Jim object
- demops.slopeDInf(jim_object)
Output the slope along the dinf drainage directions.
- Parameters:
jim_object – a Jim object
- Returns:
a Jim object
- demops.strahler(jim_object)
Compute the Strahler thing.
- Parameters:
jim_object – an image node holding d8 directions on river networks, 0 elsewhere
- Returns:
a Jim object
- class demops._DEMOps
Define all DEMOps methods.
- catchmentBasinConfluence(d8)
Compute the catchment basin confluence.
The Jim object on which this method is called should hold labelled outlet pixels with value 1 and river pixels with value 2.
Modifies the instance on which the method was called.
- Parameters:
d8 – an image node holding d8 flow directions
- catchmentBasinOutlet(d8)
Compute the catchment basin outlet.
The Jim object on which this method is called should hold labelled outlets.
Modifies the instance on which the method was called.
- Parameters:
d8 – an image node holding d8 flow directions
- contribDrainArea(graph: int)
Output the contributing drainage areas of a DEM.
Outputs the contributing drainage areas of a DEM given its graph-connected drainage directions coded as follows: NW=5, N=3, NE=7, W=1, E=2, SW=6, S=4, SE=8. The Jim object on which this method is called should contain D8 drainage directions (UCHAR).
Modifies the instance on which the method was called.
- Parameters:
graph – integer for number of possible flow directions (either 4 or 8)
Example: Compute the contributing drain area of a Jim:
jim = pj.Jim('/path/to/raster.tif')
# input for contribDrainArea() must be a D8 drainage object
jim.demops.flowDirectionD8()
jim.demops.contribDrainArea(8)
- contribDrainAreaInf()
Output the contributing drainage areas of a DEM.
Outputs the contributing drainage areas of a DEM given its dinf drainage directions. Jim object must be with Dinf drainage directions (t FLOAT, -1.0 for undefined direction).
Modifies the instance on which the method was called.
- contribDrainAreaStrat(threshold, dir)
Extract river networks.
Do it by flagging the downstreams of all points whose contributing drainage areas exceed those given by the threshold image. The dowstreams are detected by following the drainage directions stored in the image dir. Jim must be an image node (INT32) for contributing drainage area.
Modifies the instance on which the method was called.
- Parameters:
threshold – an image node (USHORT) for cda threshold levels
dir – an image node (UCHAR) for flow directions
Example: Compute the contributing drain area strat of a Jim:
jim = pj.Jim('/path/to/raster.tif')
# we need a d8 object
d8 = pj.demops.flowDirectionD8(jim)
# we need a cda object
cda = pj.demops.contribDrainArea(d8, 8)
# we need a threshold Jim
thresh = pj.pixops.setData(jim, 5)
# now we can compute the contribDrainAreaStrat()
cda.demops.contribDrainAreaStrat(thresh, d8)
- floodDir(graph: int)
Compute the local flow directions.
Compute them as the inverse of the flood wave direction occurring during an immersion simulation (i.e., flooding starting from the lowest elevations). The codes for each direction are as follows: NW=5, N=3, NE=7, W=1, E=2, SW=6, S=4, SE=8. When a pixel has no lower neighbour, it is set to 0.
Modifies the instance on which the method was called.
- Parameters:
graph – integer for number of nearest neighbours to consider (either 4 or 8)
Example: Compute the local flow directions of a Jim:
jim = pj.Jim('/path/to/raster.tif')
jim.demops.floodDir()
- flow(graph: int)
Compute the contributing drainage areas using D8 drainage directions.
Modifies the instance on which the method was called.
- Parameters:
graph – integer for number of nearest neighbours to consider
Example: Compute the contributing areas of a Jim:
jim = pj.Jim('/path/to/raster.tif')
# we need a flow direction d8 object
jim.demops.flowDirectionD8()
jim.demops.flow(8)
- flowDirectionD8()
Compute the D8 steepest slope direction of each pixel.
The codes for each direction are as follows: NW=5, N=3, NE=7, W=1, E=2, SW=6, S=4, SE=8. When a pixel has no lower neighbour, it is set to 0.
Modifies the instance on which the method was called.
Example: Compute the D8 steepest slope direction of a Jim:
jim = pj.Jim('/path/to/raster.tif')
jim.demops.flowDirectionD8()
- flowDirectionDInf()
Compute the dinf steepest slope direction of each pixel.
computes the dinf steepest slope direction of each pixel according to (Tarboton, 1997). Slope directions are measured counter-clockwise from east, i.e., range equals (0,2pi)values are in the range (0,2pi), while pixels having no dowslope (plateaus and pits) are set to -1.
Modifies the instance on which the method was called.
- flowDirectionFlat(dem_jim, graph: int)
See publication ([Soi02]).
Flat regions (i.e., no flow direction) must be of type USHORT (with flat regions set to 65533) or INT32 (with flat regions set to INT32 MAX-2). The Jim object on which this method is called should contain flat regions (USHORT or INT32).
Modifies the instance on which the method was called.
- Parameters:
dem_jim – an image node for corresponding DEM (USHORT)
graph – integer for number of nearest neighbours to consider
- flowDirectionFlatGeodesic(dem_jim, graph: int)
Inverse geodesic distance Away From Ascending Border.
Modifies the instance on which the method was called.
- Parameters:
dem_jim – a Jim object containing DEM
graph – integer for number of nearest neighbours to consider
- flowNew(drain_image, graph: int = 8)
Compute the contributing drainage area of each pixel.
Computes the contributing drainage area of each pixel of im given the graph-connected drainage directions stored in imdir.
Modifies the instance on which the method was called.
- Parameters:
drain_image – the d8 drainage directions for each pixel of im
graph – integer for connectivity (must be 8)
Example: Compute the contributing drainage area of a Jim:
jim = pj.Jim('/path/to/raster.tif')
# we need a flow direction d8 object
flow = pj.demops.flowDirectionD8(jim)
jim.demops.flowNew(flow)
- hillShade(sza_image, saa_image)
Compute the hillshade of the digital elevation model baseed on Sun angles.
- Parameters:
jim_object – a Jim object containing the digital elevation model
sza_image – a Jim object containing the Sun zenith angle per pixel data type must be identical to saa_image
saa_image – a Jim object containing the Sun azimuth angle per pixel data type must be identical to sza_image
Modifies the instance on which the method was called.
- pitRemovalCarve(grey_jim, graph: int, maxfl: int)
Use for carving, algorithm description in [SVC03]
The Jim object on which this method is called should contain labelled relevant minima.
Modifies the instance on which the method was called.
- Parameters:
grey_jim – an image node with grey tone image
graph – an integer for connectivity
maxfl – an integer for highest flooding level
Example: Compute the pit removal carve of a Jim:
jim0 = pj.Jim('/path/to/raster.tif')
# we need a labeled object
jim1 = pj.ccops.labelImagePixels(jim0)
jim1.demops.pitRemovalCarve(jim0, 8, 212)
- pitRemovalOptimal(grey_jim, graph: int, maxfl: int, flag: bool)
Optimal removal of spurious pits in grid digital elevation models.
Note that irrelevant minima must have all an intensity greater than that of the lowest minimum! The actual carved image is stored in imr. The Jim object on which this method is called should contain labelled relevant minima.
Modifies the instance on which the method was called.
- Parameters:
grey_jim – an image node with grey tone image
graph – an integer for connectivity
maxfl – an integer for highest flooding level
flag – 0 (default) for energy based, area based otherwise
Example: Compute the optimal pit removal carve of a Jim:
jim0 = pj.Jim('/path/to/raster.tif')
# we need a labeled object
jim1 = pj.ccops.labelImagePixels(jim0)
jim1.demops.pitRemovalOptimal(jim0, 8, 212, 0)
- slope(scale: float = 1.0, zscale: float = 1.0, percent: bool = False)
Compute the slope of a Jim object.
- Parameters:
scale – horizontal scale
zscale – vertical scale
percent – if True, return value in percents, degrees otherwise
- Returns:
a Jim object representing the slope
- slopeD8()
Compute the steepest slope within a 3x3 neighbourhood for each pixel.
It corresponds to the slope along the D8 direction.
Modifies the instance on which the method was called.
Example: Compute the steepest slope of a Jim:
jim = pj.Jim('/path/to/raster.tif')
jim.demops.slopeD8()
- slopeDInf()
Output the slope along the dinf drainage directions.
- strahler()
Compute the Strahler order.
Computes the Strahler order on a Jim object holding d8 directions on river networks, 0 elsewhere.
Modifies the instance on which the method was called.
Example: Compute the Strahler order of a Jim:
jim = pj.Jim('/path/to/raster.tif')
# we need a flow direction d8 object
jim.demops.flowDirectionD8()
jim.demops.strahler()
Statistics
Statistical functions
Module for statistical functions and interpolations.
- stats.getHisto1d(jim_object)
Compute the frequency distribution of the grey levels of im.
- Parameters:
jim_object – a Jim object
- Returns:
a Jim object
- stats.getHisto2d(jim_object, jim_object2)
Compute the frequency distribution of the grey levels pairs.
- Parameters:
jim_object – a Jim object
jim_object2 – a Jim object
- Returns:
a Jim object
- stats.getHisto3d(jim_object, jim_object2, jim_object3)
Compute the frequency distribution of the grey levels pairs.
- Parameters:
jim_object – a Jim object
jim_object2 – a Jim object
jim_object3 – a Jim object
- Returns:
a Jim object
- stats.getStatProfile(jim_object, function: str, **kwargs)
Get statistic profile.
- Parameters:
jim_object – a Jim object
function – string naming a statistical function
- Returns:
a Jim object
- stats.getStats(jim_object, function=['min', 'max', 'mean'], **kwargs)
Compute basic statistics on a JimList object.
Similar to the
getStats()method from Jim when jim_object is an instance of Jim, similar to thegetStats()method from JimList when jim_object is an instance of JimList. For functions requiring two datasets (e.g., regression), use the objects in the list instead of bands.- Parameters:
jim_object – either a Jim object or a JimList object
function – (list of) statistical function(s) to calculate (default is [‘min’, ‘max’, ‘mean’])
- Returns:
a dictionary with requested statistics
- stats.stretch(jim_object, **kwargs)
Stretch Jim.
- Parameters:
jim_object
kwargs
- Returns:
Statistical methods on Jim
- class stats._Stats
Define all statistical methods.
- getHisto1d()
Compute the frequency distribution of the grey levels of im.
- Returns:
a Jim object
- getHisto2d(jim_object2)
Compute the frequency distribution of the grey levels pairs.
- Parameters:
jim_object2 – a Jim object
- Returns:
a Jim object
- getHisto3d(jim_object2, jim_object3)
Compute the frequency distribution of the grey levels pairs.
- Parameters:
jim_object2 – a Jim object
jim_object3 – a Jim object
- Returns:
a Jim object
- getHistoCumulative()
Compute the cumulative frequency distribution of the grey levels.
- Returns:
a Jim object
- getStats(function=['min', 'max', 'mean'], **kwargs)
Compute basic statistics on a Jim object.
For functions requiring two datasets (e.g., regression), use a multi-band Jim object (or use the
getStats()method from JimList.- Parameters:
function – (list of) statistical function(s) to calculate (default is [‘min’, ‘max’, ‘mean’])
- Returns:
a dictionary with requested statistics
- Statistical functions:
function
description
invalid
Count number of invalid pixels (nodata)
valid
Count number of valid pixels (nodata)
basic
Calculate min, max, mean, and stdev
mean
Calculate the mean
median
Calculate the median
var
Calculate the variance
skewness
Calculate the skewness as measure of assym.
kurtosis
Calculate the kurtosis as measure of outliers
stdev
Calculate the standard deviation
minmax
Calculate min and max
min
Calculate min
min
Calculate max
histogram
Calculate the historgram
histogram2d
Calculate the historgram based on 2 bands
rmse
Calculate the RMSE based on 2 bands
regression
Calculate the regression based on 2 bands
Examples:
Calculate min and max:
jim = pj.Jim('/path/to/raster.tif')
statDict = jim.stats.getStats(['min', 'max'])
print('max value is: {}".format(statDict['max']))
print('min value is: {}".format(statDict['min']))
Calculate the histogram (returning a dictionary with keys ‘bin’ and ‘histogram’):
jim = pj.Jim('/path/to/raster.tif')
histDict = jim.stats.getStats('histogram')
Calculate the histogram, using 10 bins. Start reading from value 0 and stop reading up to value 100. Do not consider values equal to 0:
jim = pj.Jim('/path/to/raster.tif')
histDict = jim.stats.getStats('histogram', nbnin=10, src_min=0,
                              src_max=100, nodata=0)
print(histDict)
output:
{'bin': [5.0, 15.0, 25.0, 35.0, 45.0,
         55.0, 65.0, 75.0, 85.0, 95.0],
'histogram': [38543.0,
              29991.0,
              49251.0,
              40006.0,
              12945.0,
              2520.0,
              112.0,
              0.0,
              0.0,
              0.0]}
Statistical methods on JimList
- class stats._StatsList
Define all statistical methods for JimLists.
- getStatProfile(function: str, **kwargs)
Get statistic profile.
- Parameters:
function – string naming a statistical function
- getStats(function=['min', 'max', 'mean'], **kwargs)
Compute basic statistics on a JimList object.
Similar to the
getStats()method from Jim. For functions requiring two datasets (e.g., regression), use the objects in the list instead of bands- Parameters:
function – (list of) statistical function(s) to calculate (default is [‘min’, ‘max’, ‘mean’])
- Returns:
a dictionary with requested statistics
- Statistical functions:
function
description
invalid
Count number of invalid pixels (nodata)
valid
Count number of valid pixels (nodata)
basic
Calculate min, max, mean, and stdev
mean
Calculate the mean
median
Calculate the median
var
Calculate the variance
skewness
Calculate the skewness as measure of assym.
kurtosis
Calculate the kurtosis as measure of outliers
stdev
Calculate the standard deviation
minmax
Calculate min and max
min
Calculate min
min
Calculate max
histogram
Calculate the historgram
histogram2d
Calculate the historgram based on 2 bands
rmse
Calculate the RMSE based on 2 bands
regression
Calculate the regression based on 2 bands
Examples:
Calculate regression between two Jim objects:
jim0 = pj.Jim('/path/to/raster0.tif')
jim1 = pj.Jim('/path/to/raster1.tif')
theStats = pj.JimList([jim0,jim1]).stats.getStats('regression)
print(theStats)
output:
{‘c0’: 10.0102, ‘c1’: 0.633352, ‘r2’: 0.491198}
Calculate root mean square error between two Jim objects:
jim0 = pj.Jim('/path/to/raster0.tif')
jim1 = pj.Jim('/path/to/raster1.tif')
theStats = pj.JimList([jim0, jim1]).stats.getStats('rmse')
print(theStats)
output:
{‘rmse’: 10.4638}